How a new customer starts with nventr: map the business first — systems, data, processes, people — then let the platform propose the optimizations worth doing, build them, and track every one against a savings forecast the platform proves from what actually ran.
Or hear it from NoVA — map, optimize, build, track — and interrupt with questions.
Part I
Why map first
nventr starts with your business, not with the software. The Blueprint is the picture everything else follows from.
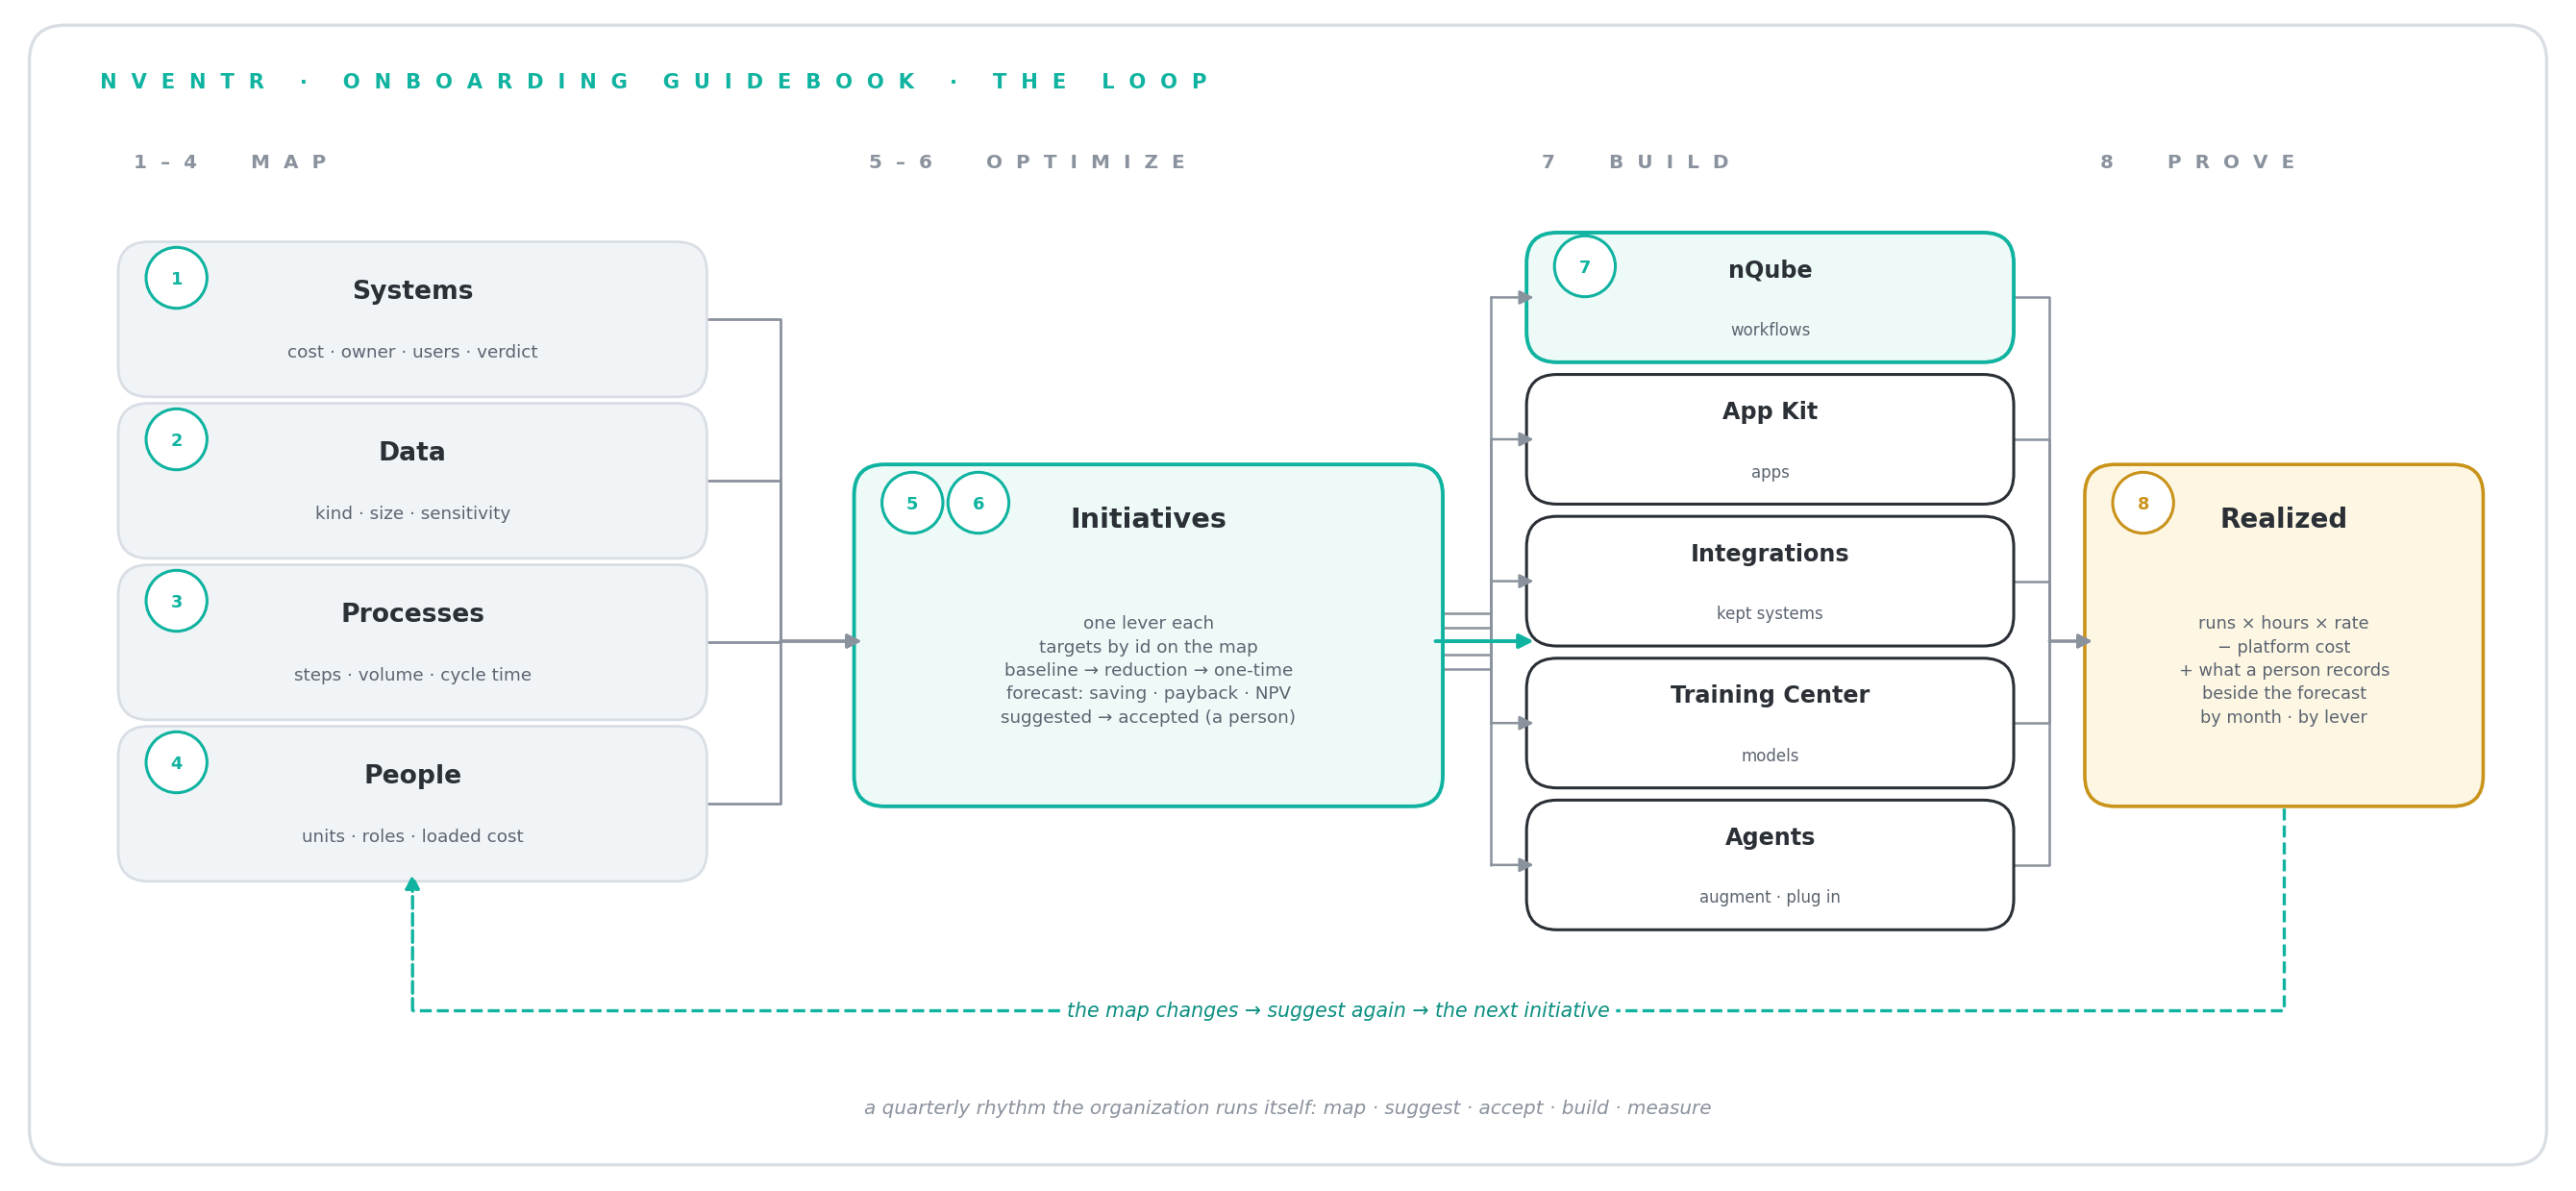
The loop — four maps feed the initiatives, the initiatives are built on the platform and measured, and the map changes again; the numbers are the Blueprint's step rail
The one idea
Before anything is built, the platform asks you to put down, in plain structured form, what you already have: the systems people live in, the places your data sits, the processes that eat the hours, and the people who do the work. That picture is the Blueprint.
Every optimization nventr can build — a workflow, an app, a model, an agent — is only worth building if it pays for itself against something real: a cost you carry today in licenses, hours, headcount or delay. The map is where those costs are written down. With it, the platform can point at the specific process, system or role, say what it would change, and put a number on it you can argue with.
A business map — systems with cost and a verdict (keep, augment, replace, retire), data stores with sensitivity, processes with steps, volume and cycle time, an org chart with loaded cost.
A portfolio of initiatives — each a named optimization against named records, with a lever, a rationale, a forecast and a status. nventr proposes; a person accepts.
Deliverables on the platform — the workflows, apps, agents, models and integrations each initiative produced, linked back to it.
A forecast you can defend — baseline, reduction, one-time and platform cost per initiative; annual savings, payback and three-year NPV for the plan.
Realized savings, measured — from the month an initiative goes live the platform counts what ran, prices the hours it displaced at your rates, subtracts what it cost, and writes the result beside the forecast.
How NoVA runs this with you
NoVA interviews: open the Blueprint and say "map my business" and it asks one question at a time, recording each answer onto the map. It proposes: once the map has systems and a process with steps, "what should we automate first" produces initiatives tied to the records that justify them. It tracks: "how are we doing" reads the plan back.
Two things NoVA never does. It never accepts an initiative — that is a person's click. And it never invents a saving — every number traces to a field on the map, a counted run, or a figure a person typed in with their name on it.
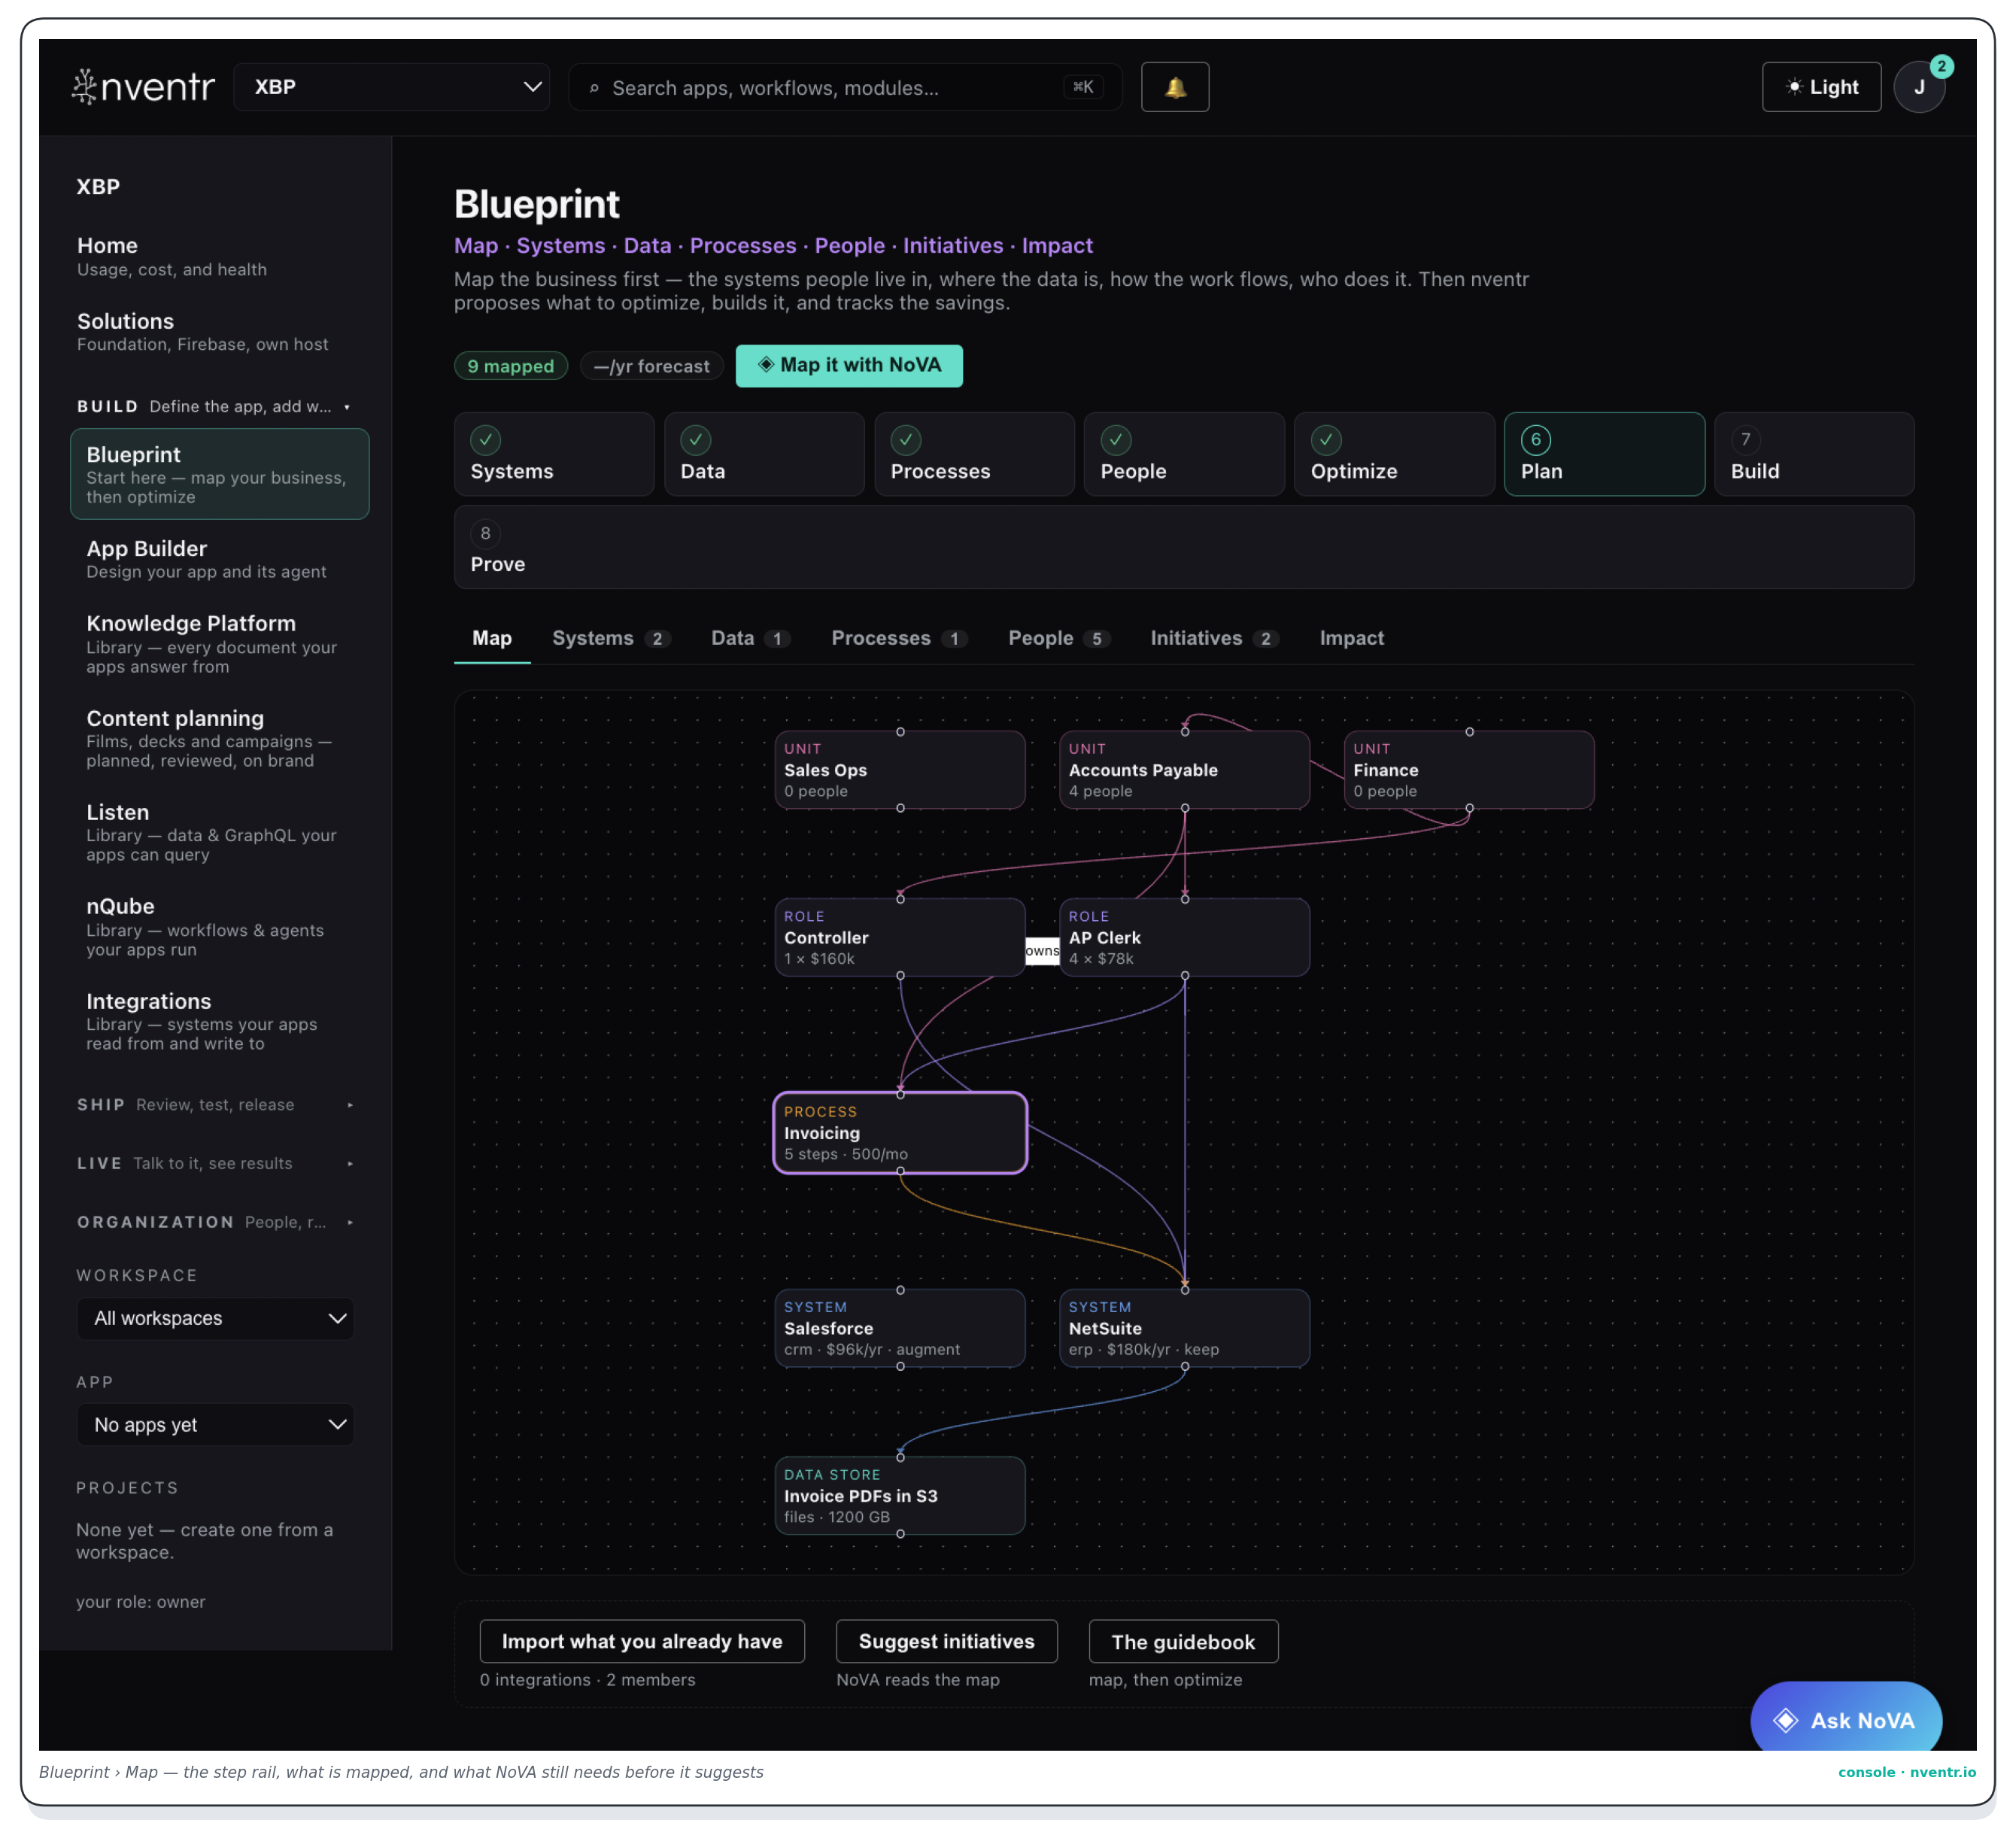
The Blueprint in the console — the step rail across the top, the records NoVA has mapped so far, and the verbs along the bottomPart II
The four maps
Systems, data, processes, people. Each has a worksheet; the three heaviest processes, mapped fully, are what pays.
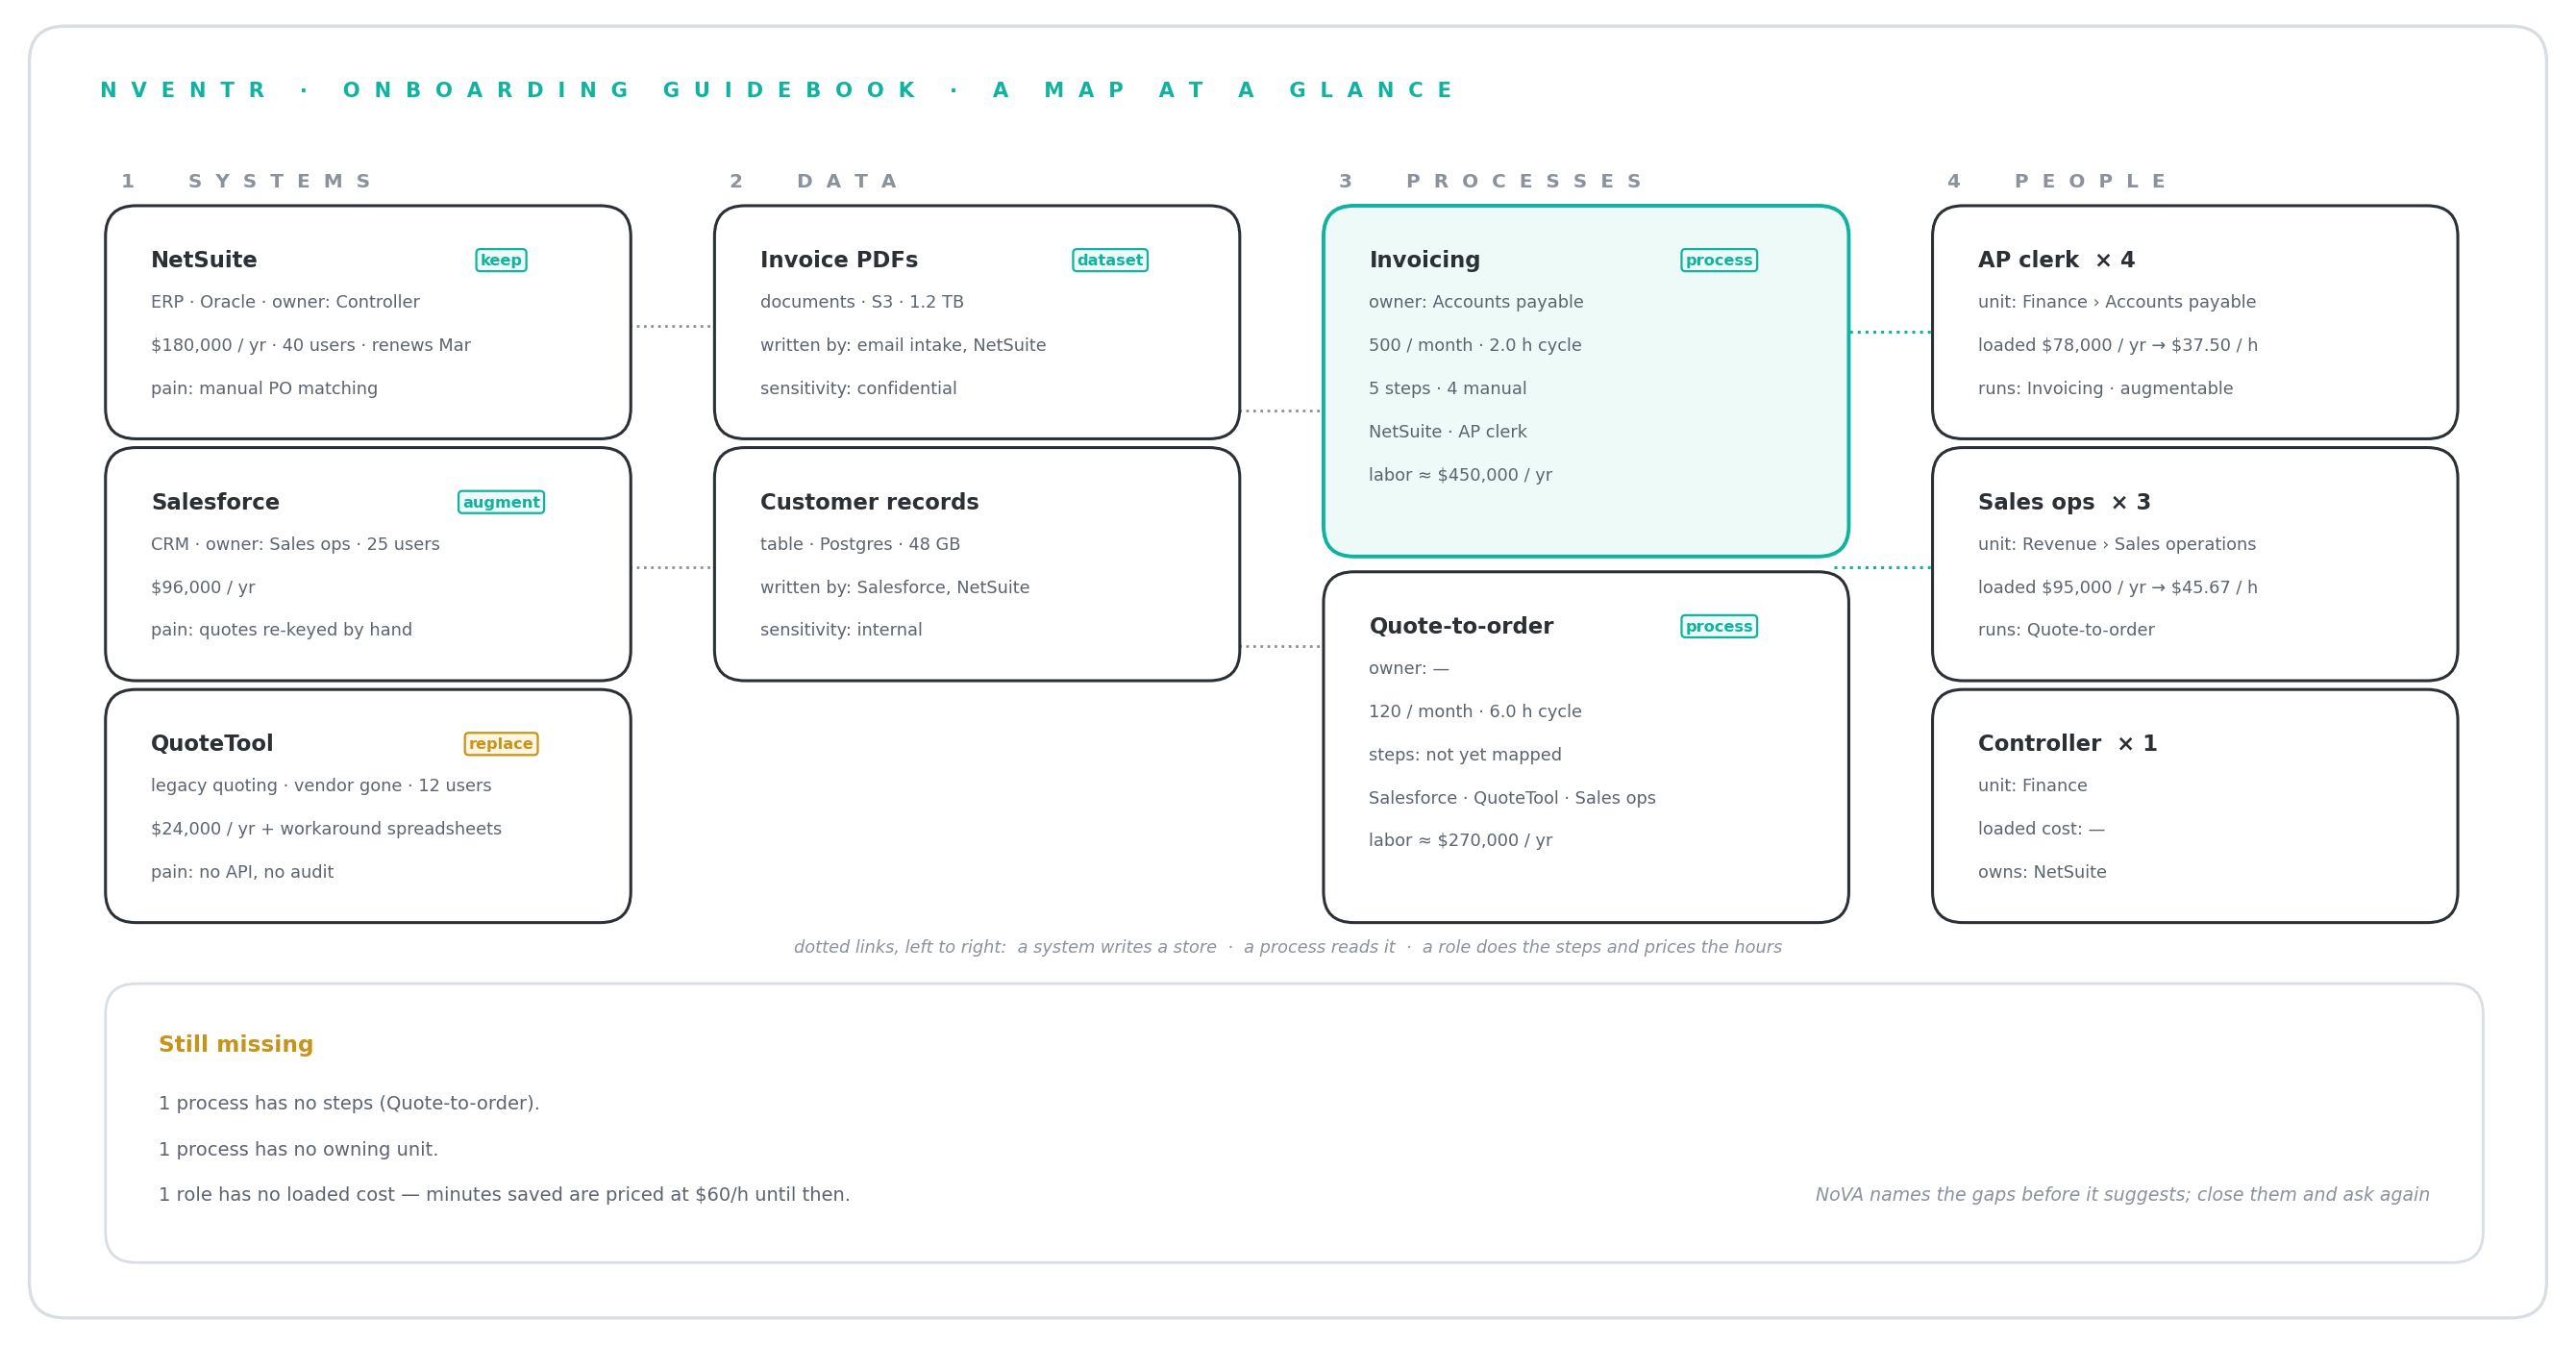
A map at a glance — three systems with verdicts, two data stores, two processes, three roles, the links between them, and what NoVA says is still missing
Systems — what you pay for and where people live
For each system record a name, a category, the vendor, the yearly cost, the renewal date, the owning role, how many people use it and the pain points people name without prompting. Then give it a verdict — keep, augment, replace, retire — or leave it undecided. The verdict is the first optimization decision you make, before the platform suggests anything. If you already connect systems through nventr Integrations, the Blueprint imports them in one click.
A data store is any place records accumulate: a database behind a system, a warehouse or lake, a file share, a spreadsheet, a SaaS API. Record its kind, engine, rough size, which systems write to it and its sensitivity — public, internal, confidential, regulated. Sensitivity decides what a model may be trained on and what an agent may read; nventr enforces that at the data layer, not in a prompt. A process with ten thousand historical decisions in a store you control is a model waiting to be trained.
Worksheet name · kind · engine · size · sensitivity · systems that write it
Processes — where the hours go
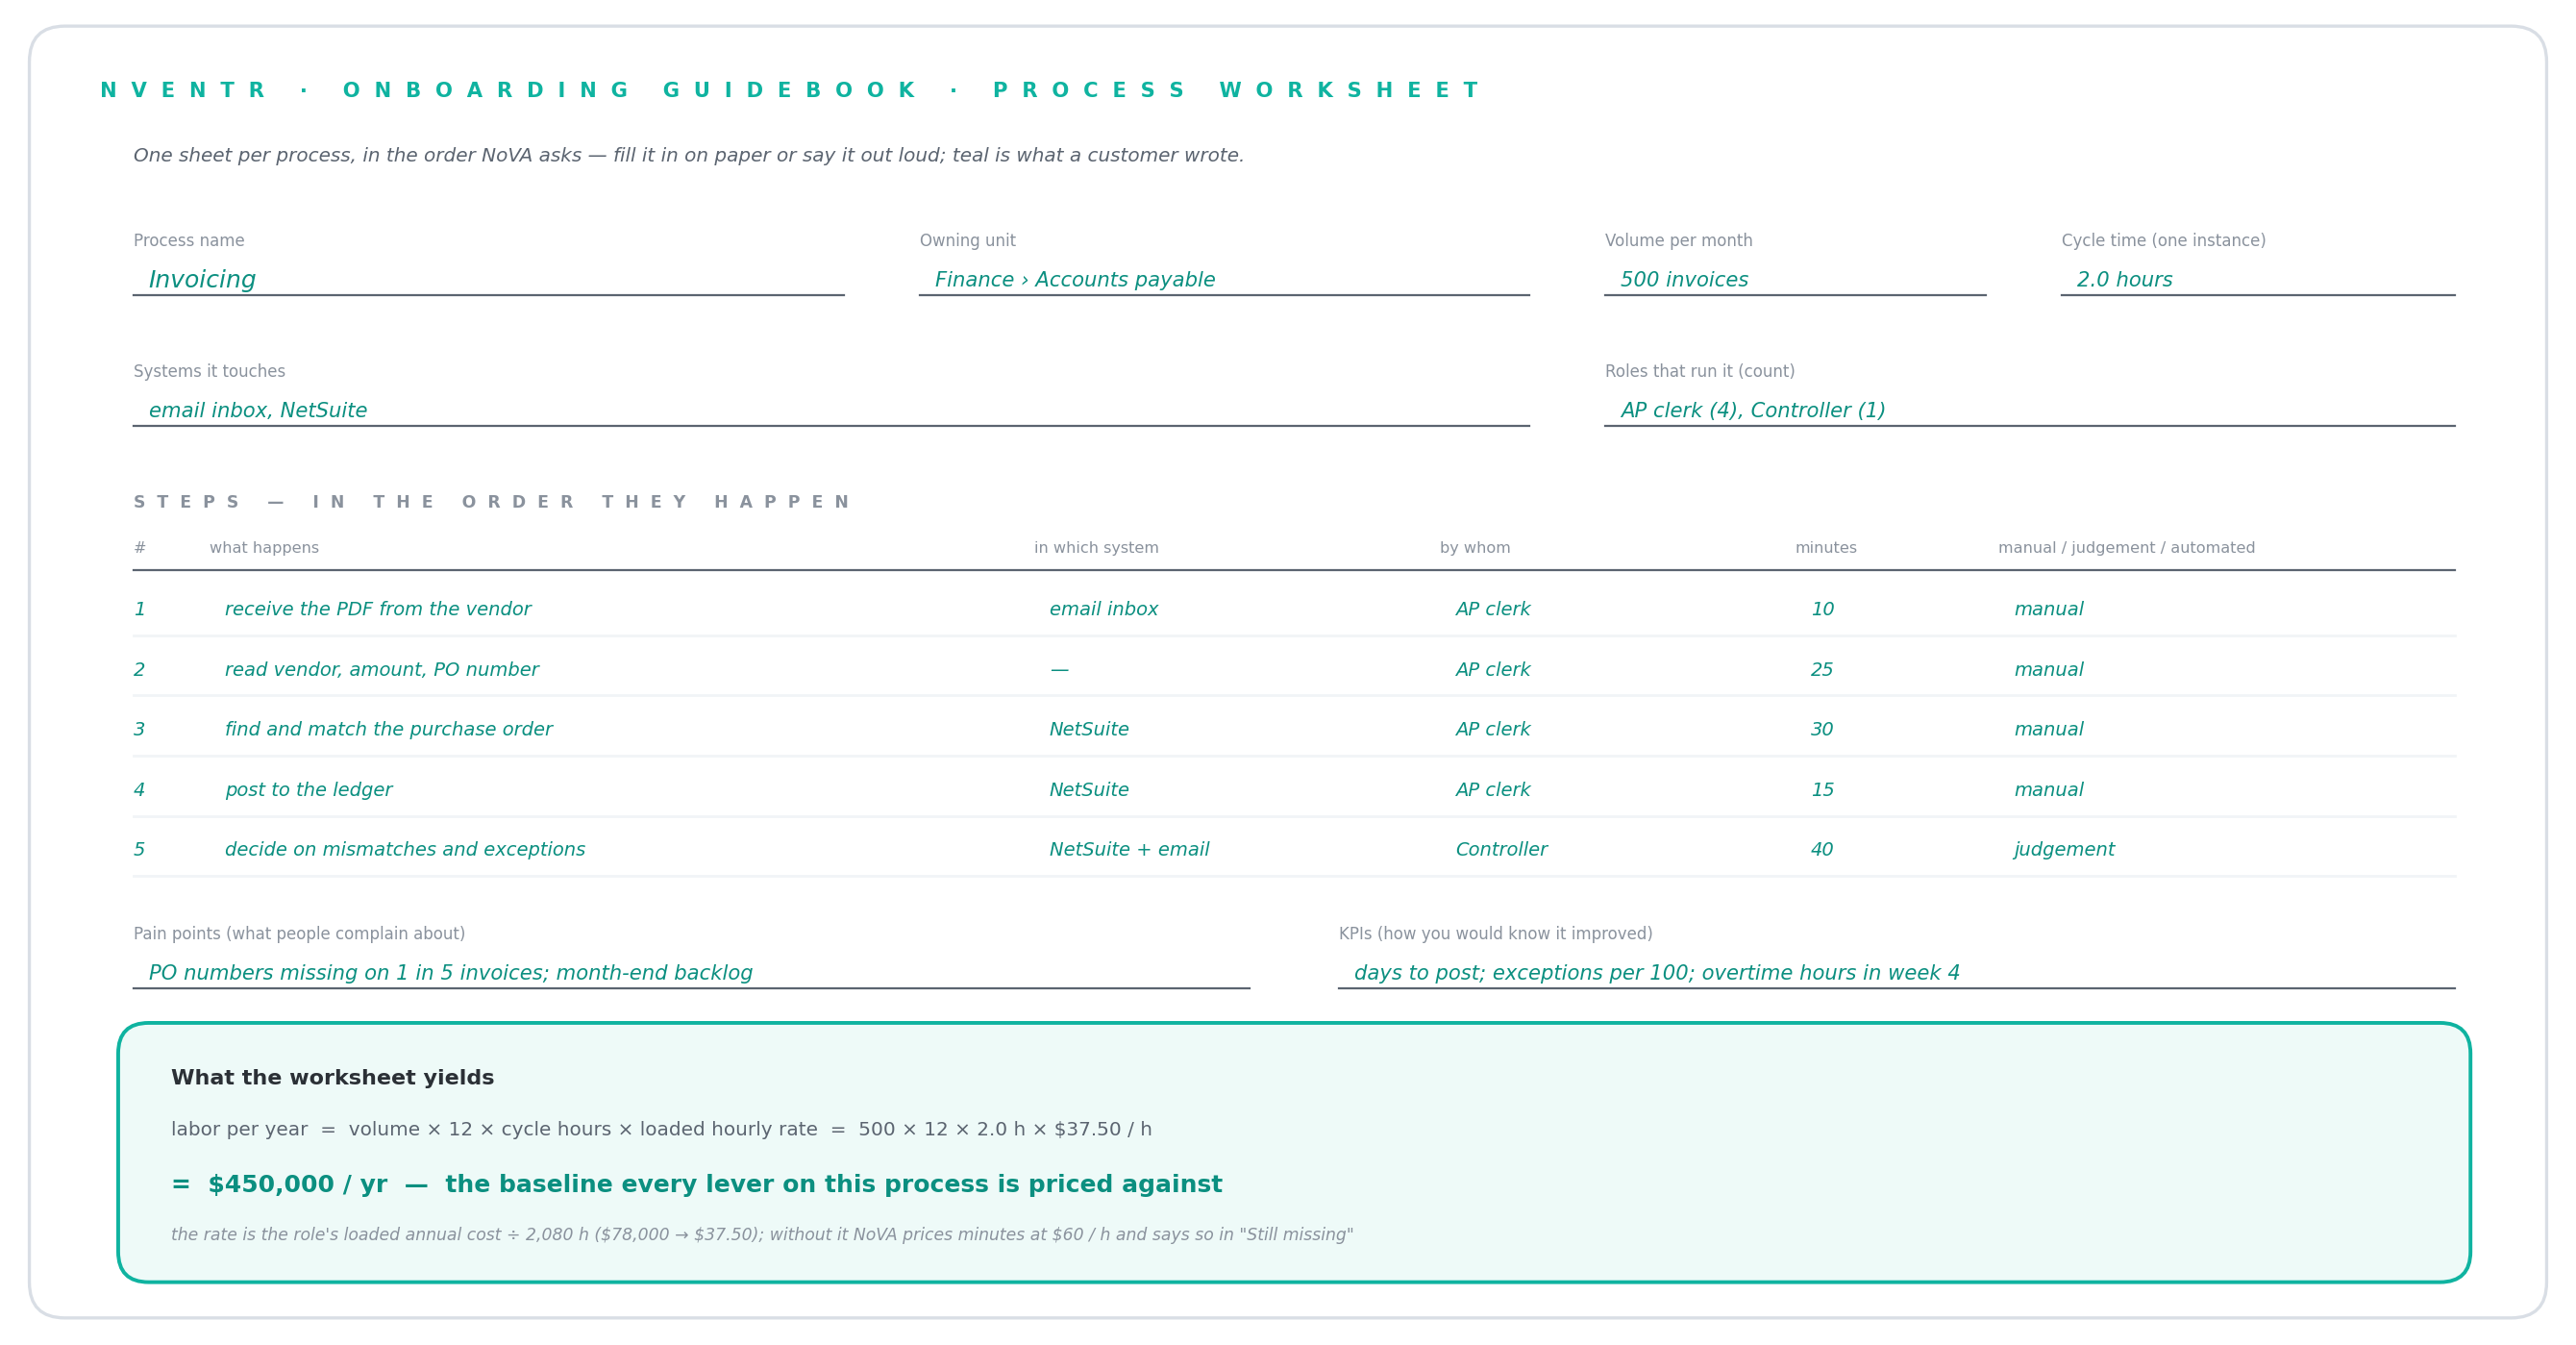
A process is a repeatable piece of work with a start and an end. Record the owning unit, the steps in order — each naming the system it happens in and the role that does it — the volume per month and the cycle time of one instance in hours. Volume and cycle time are what the forecast is built from: five hundred a month at two hours each is a thousand hours a month, priced at the loaded rate of the role that does it. Be honest about cycle time; the saving is only as real as the baseline. Map the three heaviest processes fully before mapping twenty shallowly.
Worksheet name · owning unit · steps (name · system · role · minutes) · volume/month · cycle hours · pain points · KPIs
The process worksheet, filled in for invoicing — the questions in the order NoVA asks them, and the yearly labor figure the answers yield
People — who does the work
The org chart on the Blueprint is units and roles, not names. A unit has a parent, a head role and a headcount. A role belongs to a unit, has a headcount and a loaded annual cost per person, lists the processes it runs and the systems it uses, and carries one flag: augmentable — would this role be better with an agent beside it than with another hire? Loaded cost prices every hour saved on the process map. If your team is already on nventr, the Blueprint imports your members as roles by their seat.
Worksheet unit · parent · head role · headcount · role · loaded cost · processes · systems · augmentable
Part III
The six levers
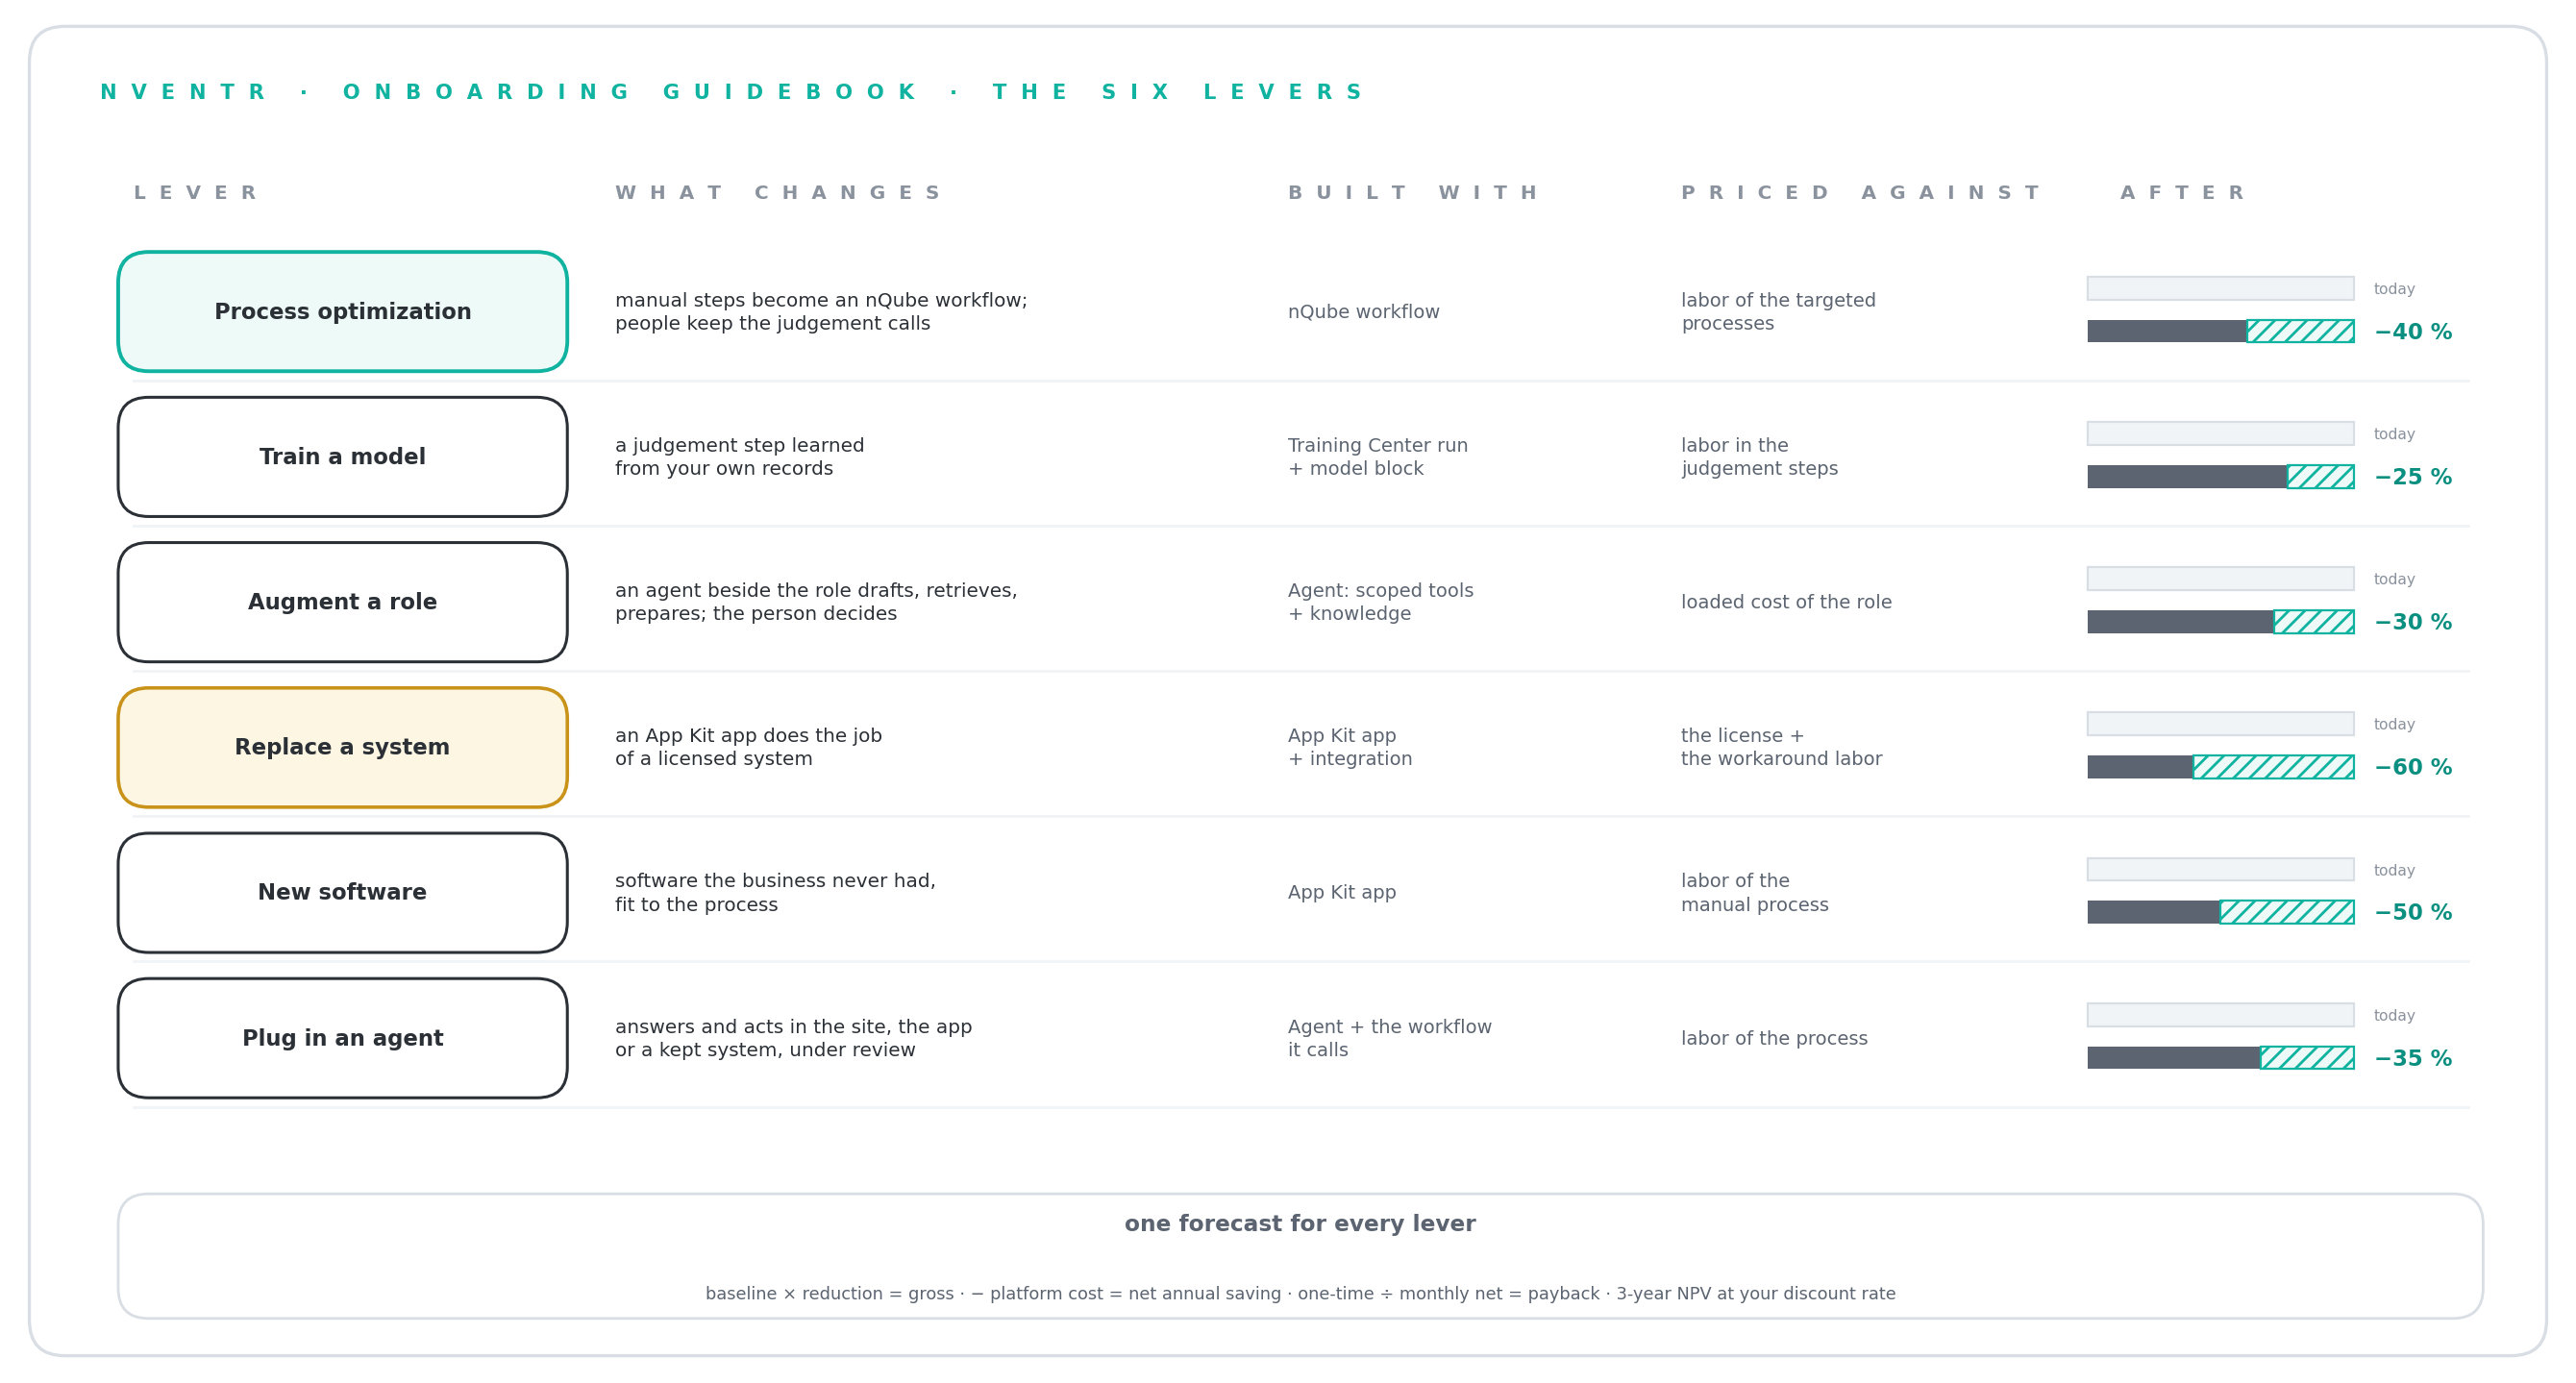
Every initiative pulls one of six levers, so a plan reads at a glance and every proposal is priced the same way.
The six levers — what each one changes, what it is built from, what it is priced against, and the typical share of the baseline it removes
From a map to a proposal
When you ask NoVA what to optimize it reads the whole map, finds the heaviest manual process, the costliest system with a replace or retire verdict, the most augmentable role and the data store rich enough to train on, and proposes one initiative per lever the map can support — never one the map cannot justify, never a duplicate. Each proposal names its targets, so you can click from the initiative to the process it would change. Suggestions wait as "suggested" until a person accepts or rejects them.
The levers
Process optimization — a workflow on nQube takes a manual multi-step process down to one review or none. Baseline: the labor of the targeted processes. Typical reduction 40 percent. The fastest to build and the easiest to measure.
Train a model — a model trained on your own records replaces a judgment step. Baseline: the labor in the judgment steps. Typical reduction 25 percent. Needs a data store with history.
Augment a role — an agent beside a capacity-bound role: it drafts, retrieves, prepares; the person decides. Baseline: the loaded cost of the role. Typical reduction 30 percent, usually realized as deferred hiring.
Replace a system — an App Kit app replaces a system with a replace or retire verdict, on your infrastructure, with your data in it. Baseline: the license plus the workaround labor. Typical reduction 60 percent. Sequence it after a workflow win.
New software — an app for something no system does today. Baseline: the labor of the manual process. Typical reduction 50 percent.
Plug in an agent — an agent on the website, in the app or inside a kept system, answering and acting under review. Baseline: the labor of the process. Typical reduction 35 percent.
Choosing the first one
The right first initiative targets a fully mapped process, pulls the process or augment lever because those ship in weeks, pays back in under six months on the forecast, and has its owner in the room. A plan that starts with a system replacement spends its first quarter on migration; a plan that starts with the heaviest manual process shows a realized number by month two — and that number wins the room for the bigger levers.
Part IV
Building it
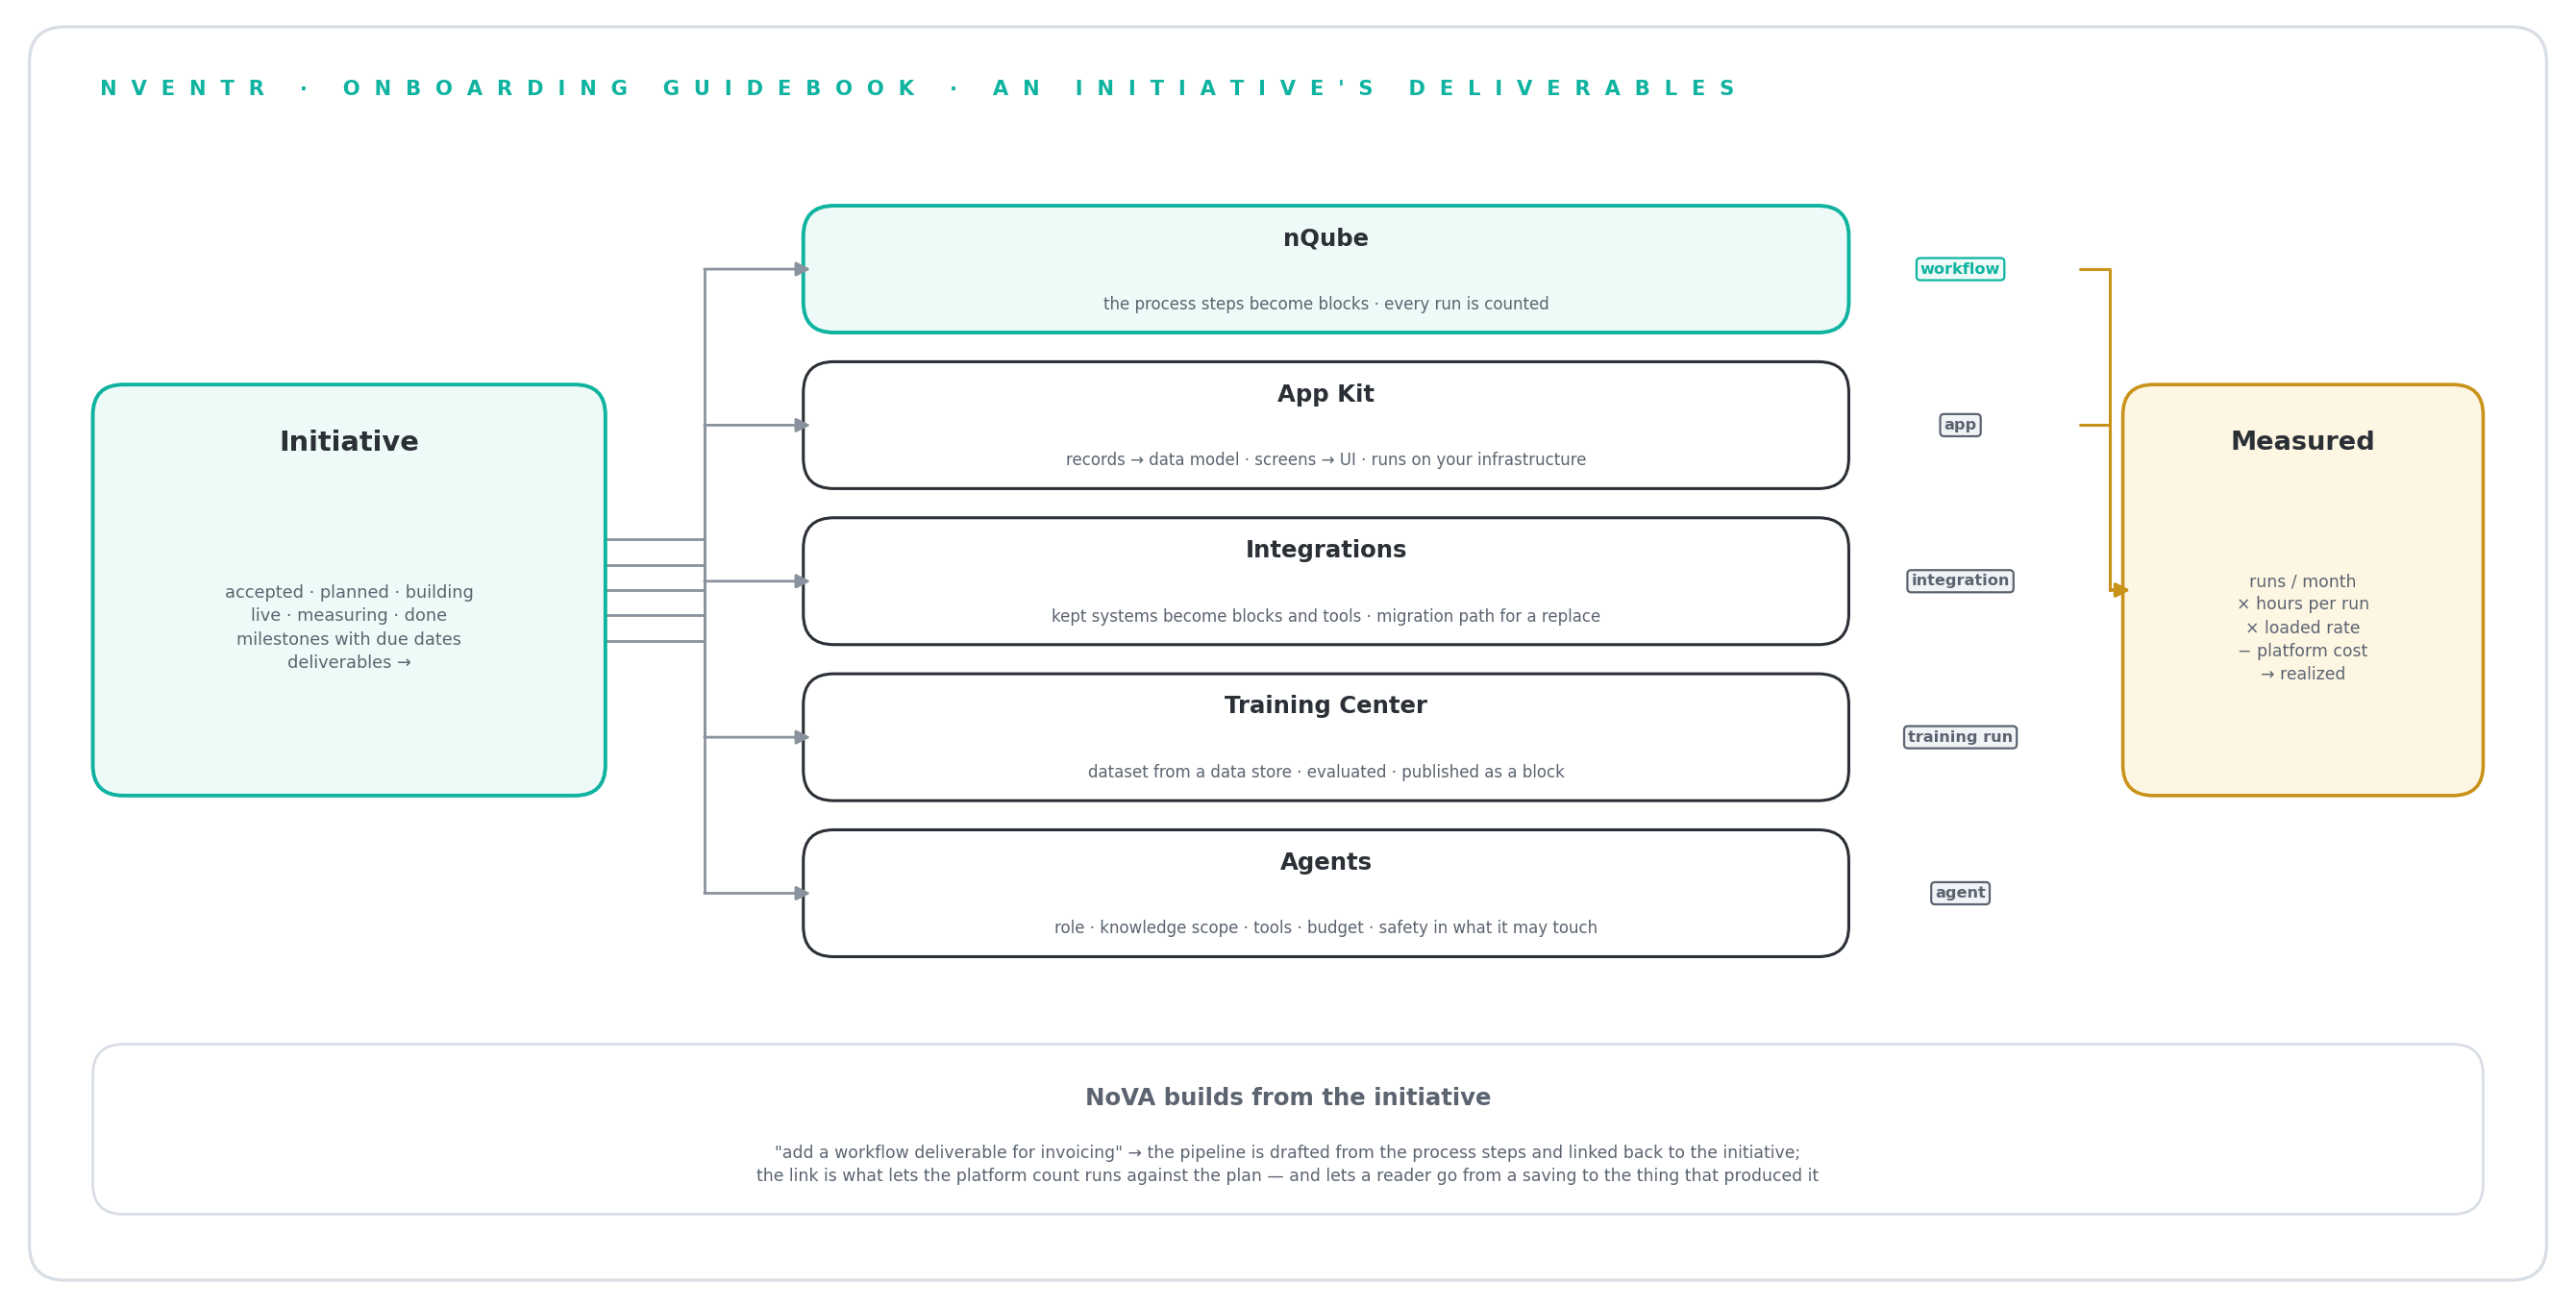
An accepted initiative is a list of deliverables, each built with one part of the platform and linked back to the plan.
What gets built — an initiative's deliverables across nQube, the App Kit, Integrations, the Training Center and Agents, each linked back to the plan
Your first workflow on nQube
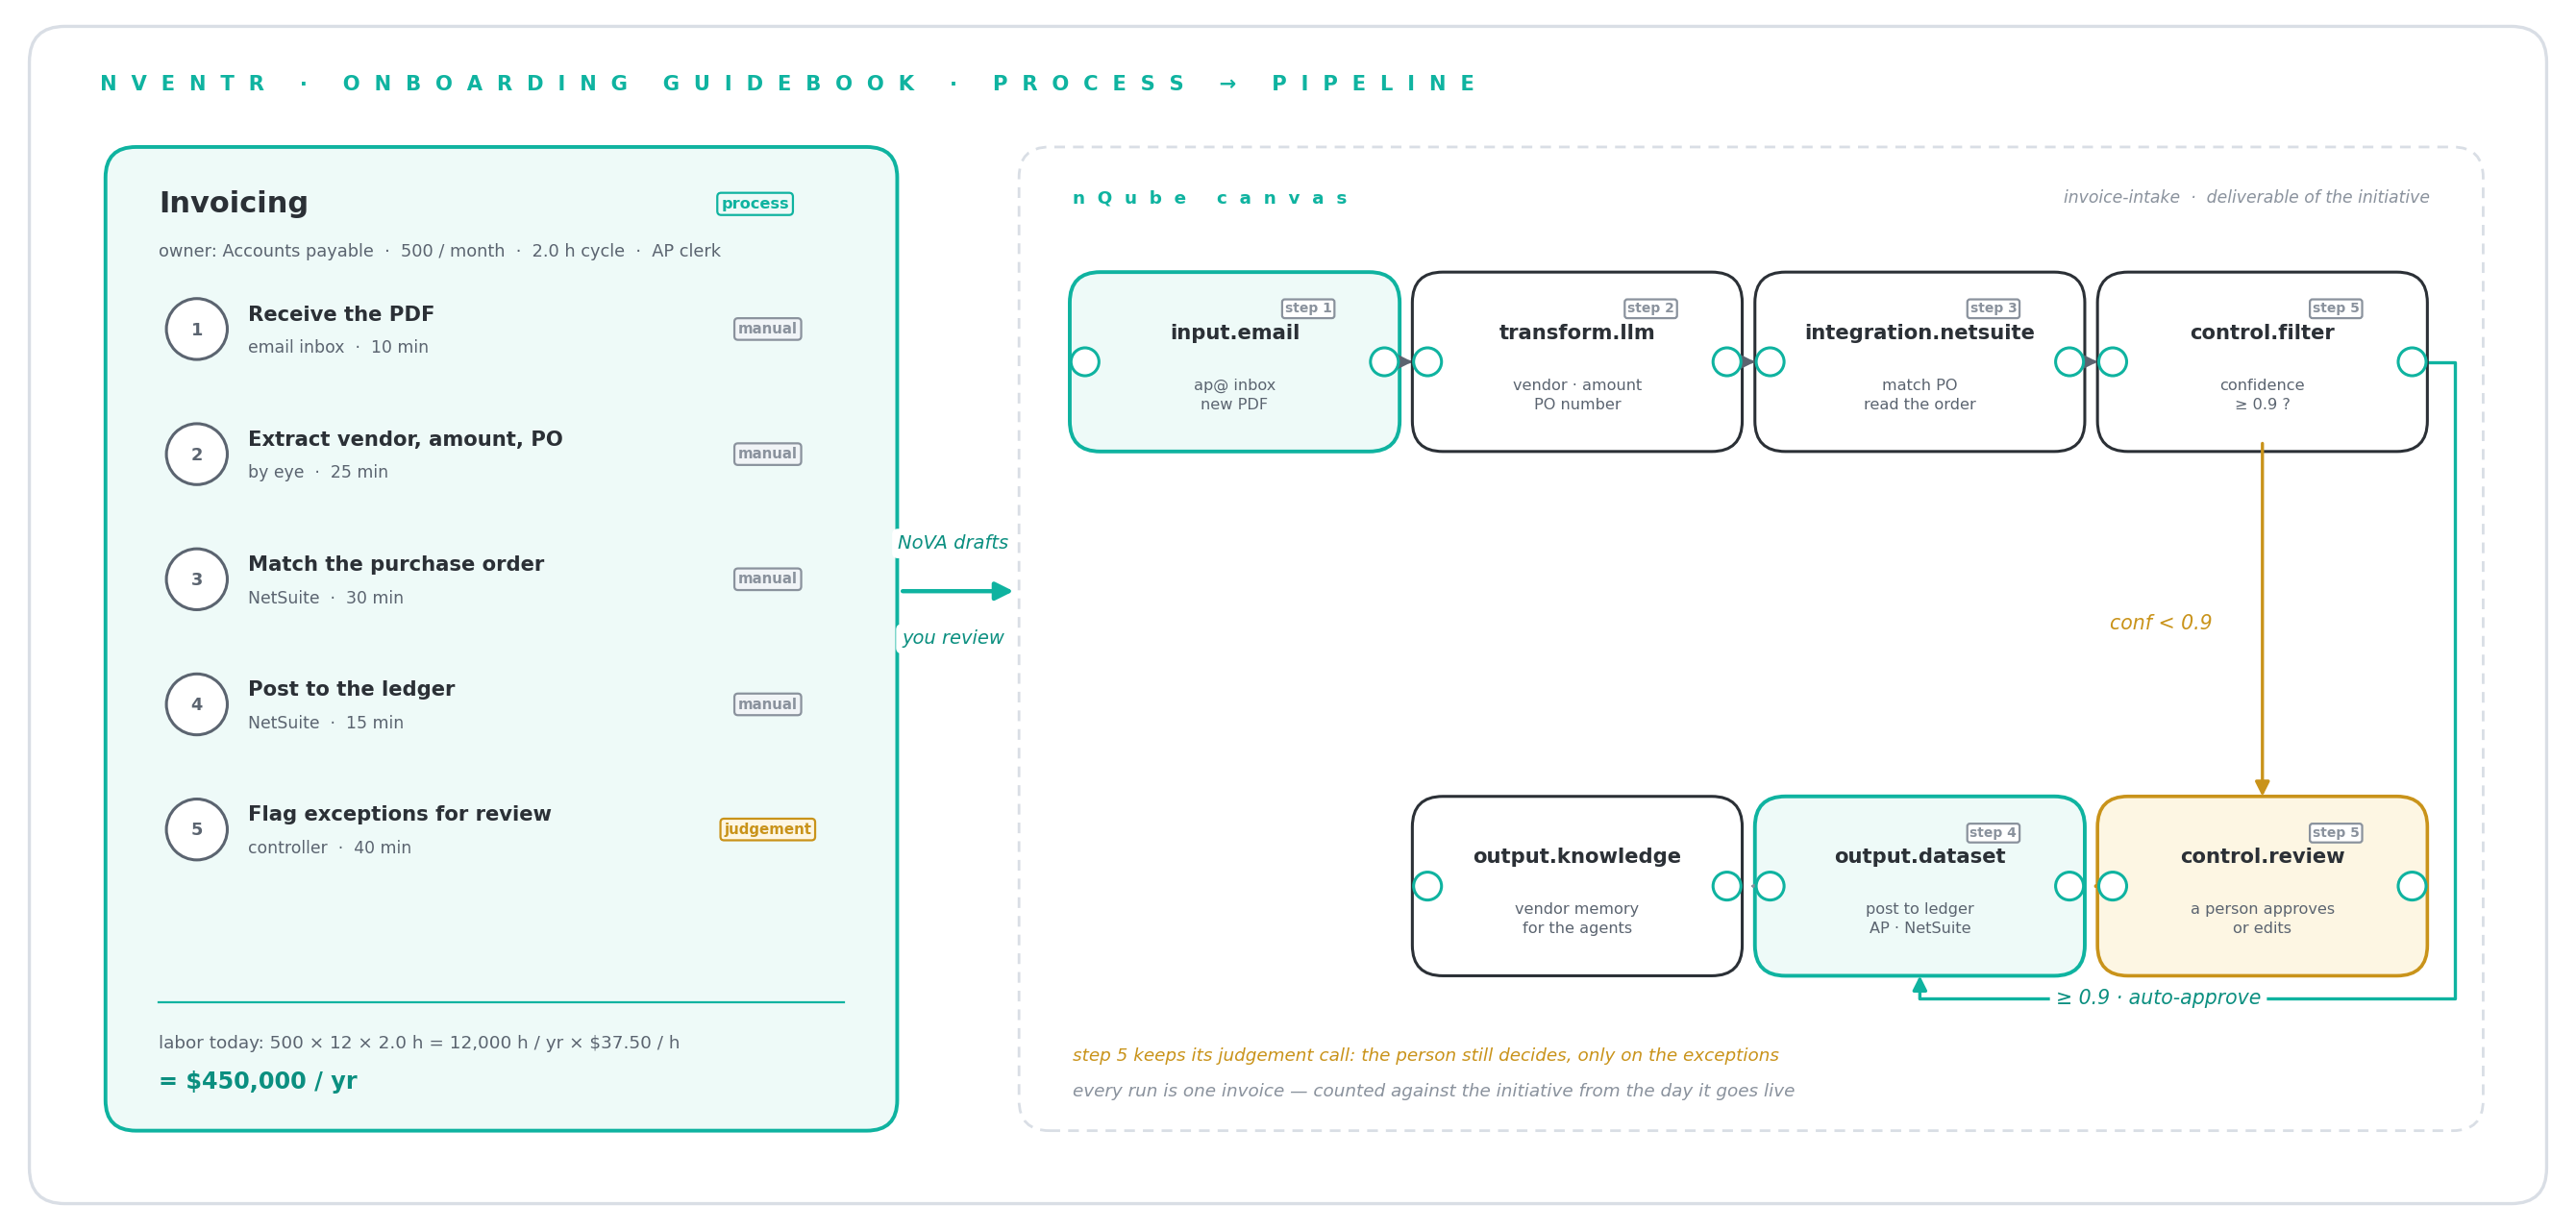
Open the initiative, add a deliverable of kind workflow, and tell NoVA the process in the words from the map. NoVA drafts the pipeline from the process steps; you review it on the canvas and run it against real cases before switching it on. Every run is counted against the initiative from that day.
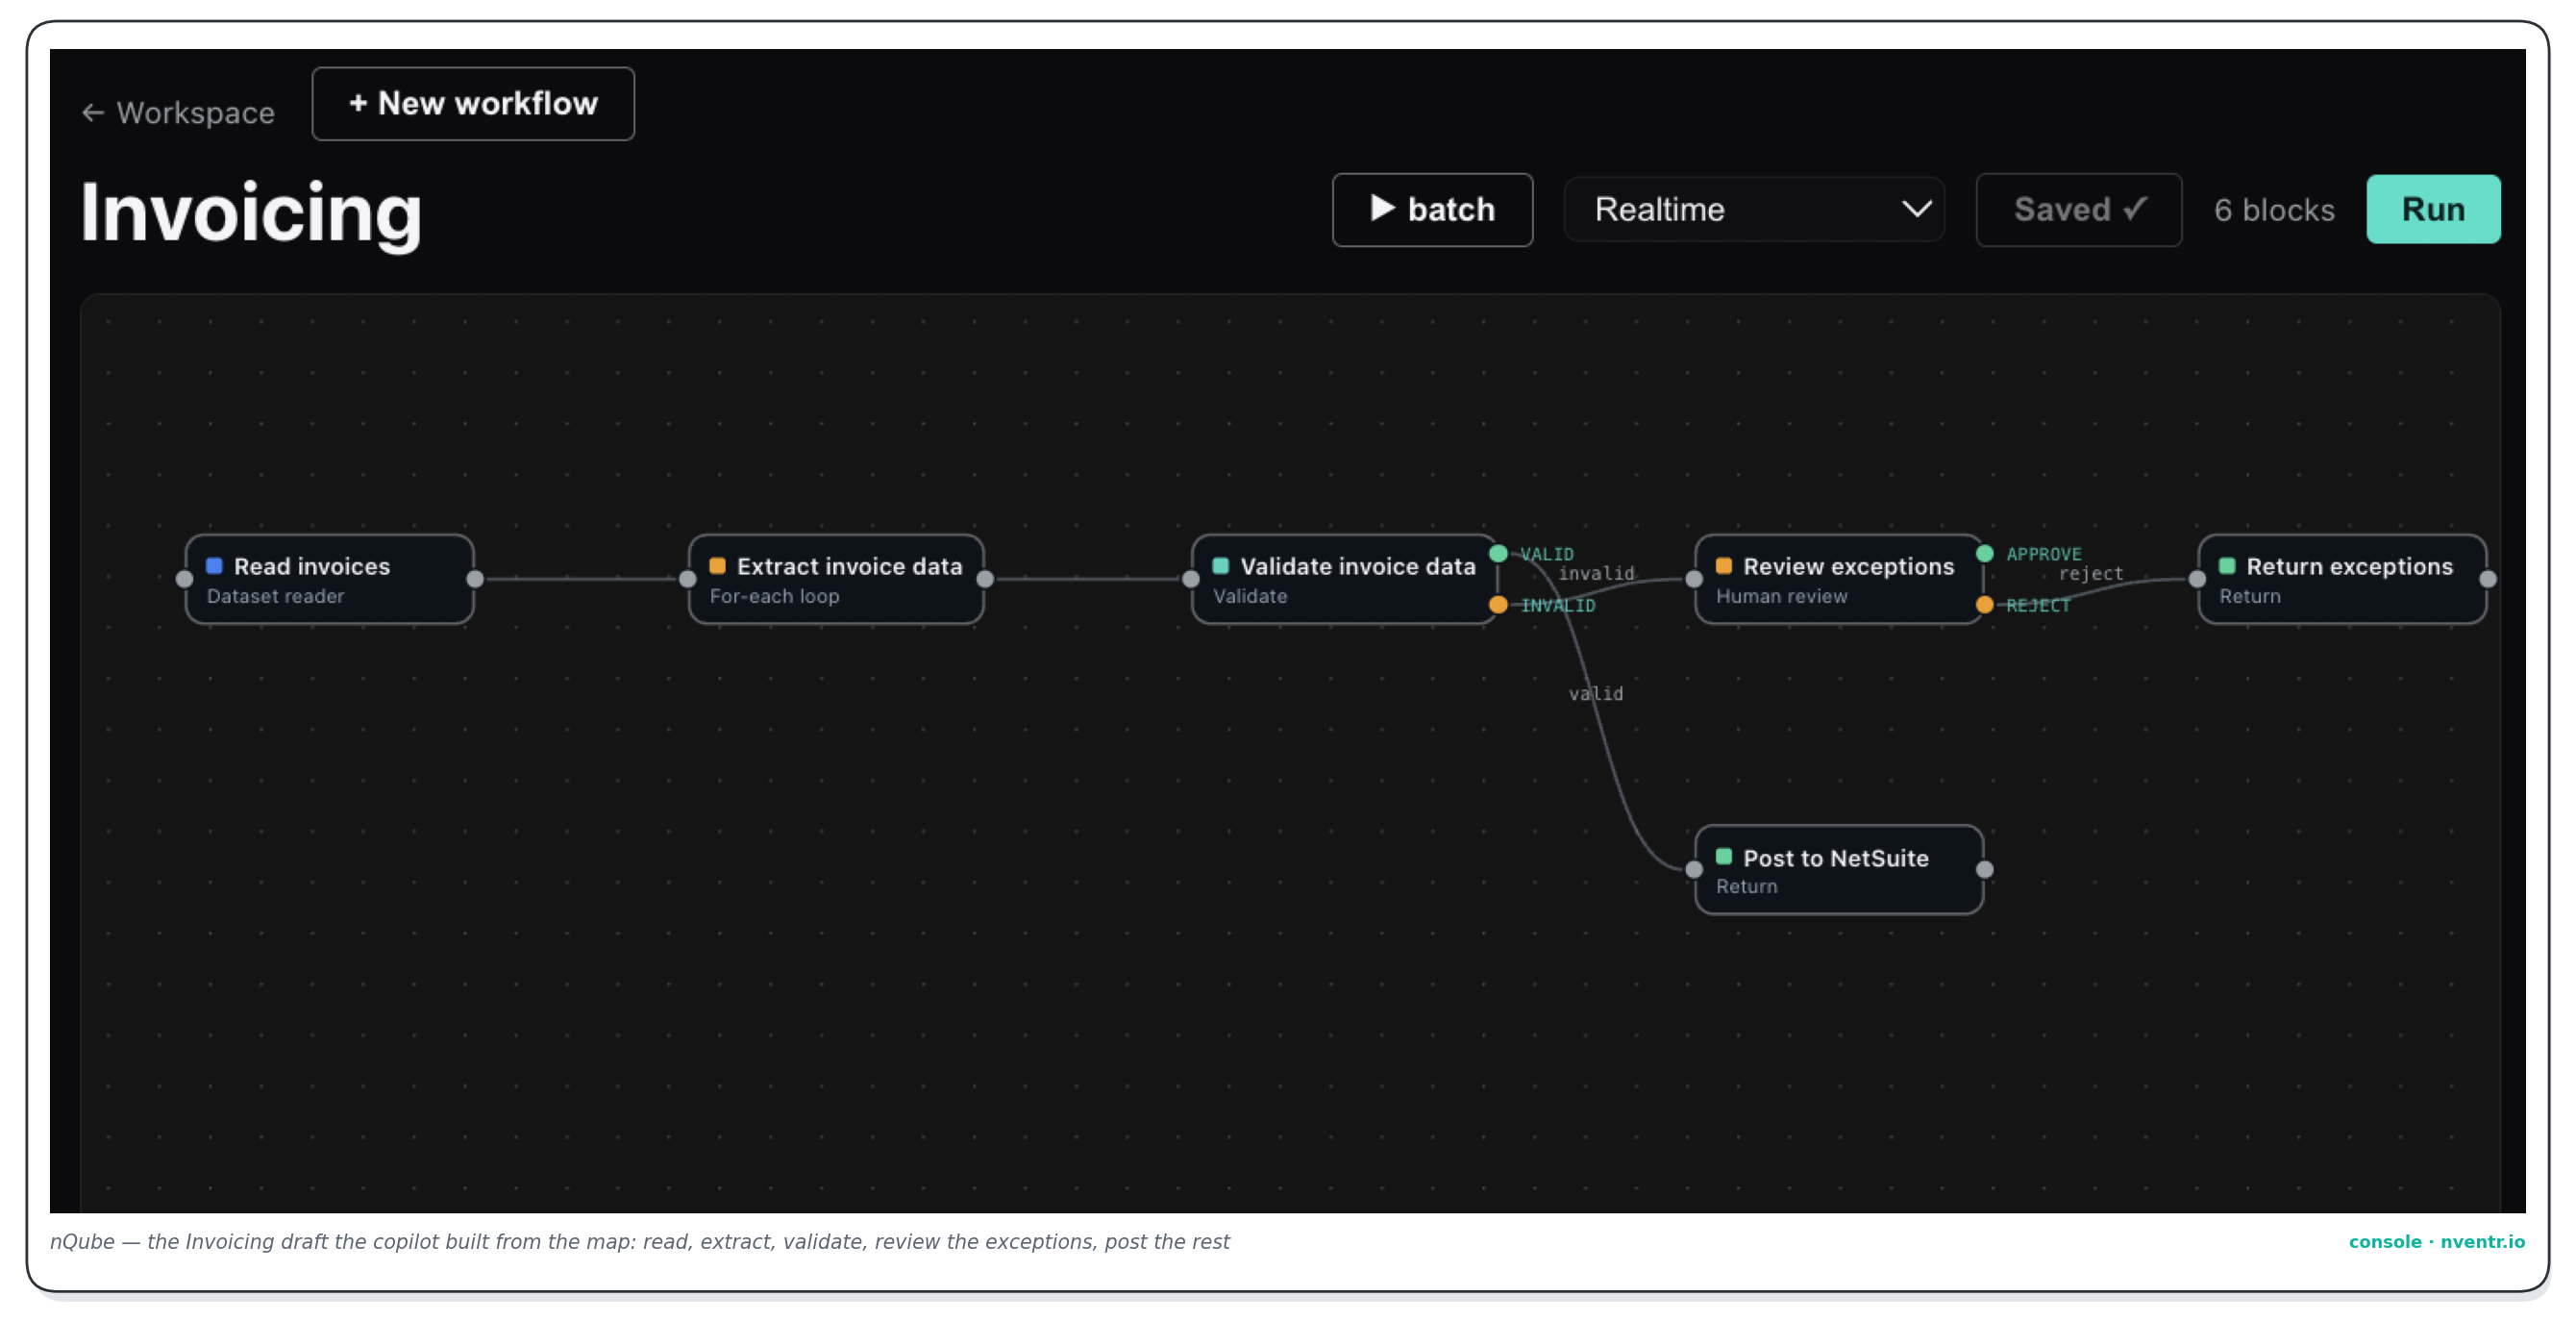
From a process on the map to a pipeline on nQube — the five invoicing steps become blocks; the judgement step keeps its person, now only for the exceptionsThe Invoicing pipeline on nQube — drafted by the copilot from the initiative on the map: read the invoices, extract each, validate, send the exceptions to a person, post the rest
Your first app on the App Kit
Add a deliverable of kind app and start from the system you are replacing: its records become the data model, its screens the first interface, the integration to the old system the migration path. The app runs on your infrastructure or nventr's, with your data in it either way; its running cost lands in the initiative's realized column automatically, so the saving is net.
Connecting what you keep
Most systems get kept and connected. Integrations give workflows, apps and agents authenticated access to the systems on your map; a kept system becomes a block on the canvas and a tool an agent can use.
Your first model in the Training Center
Add a deliverable of kind training run, point it at the dataset the initiative targets, and let NoVA propose the task and the evaluation. The model publishes as a block for workflows and a tool for agents. Nothing trains on a store marked confidential or regulated without the permission the data map requires.
Your first agent
An agent is a scoped worker: a role, the knowledge it may read, the tools it may use, the budget it may spend, the person it reports to. For an augment initiative it sits beside the role; for a plug-in initiative it runs the process within its scope and escalates the rest. Safety lives in what the agent is allowed to touch, never in the wording of its instructions.
Part V
Tracking and forecasting
The same forecast model in the console, in NoVA's answers and in the hourly rollup — and a realized column the platform measures.
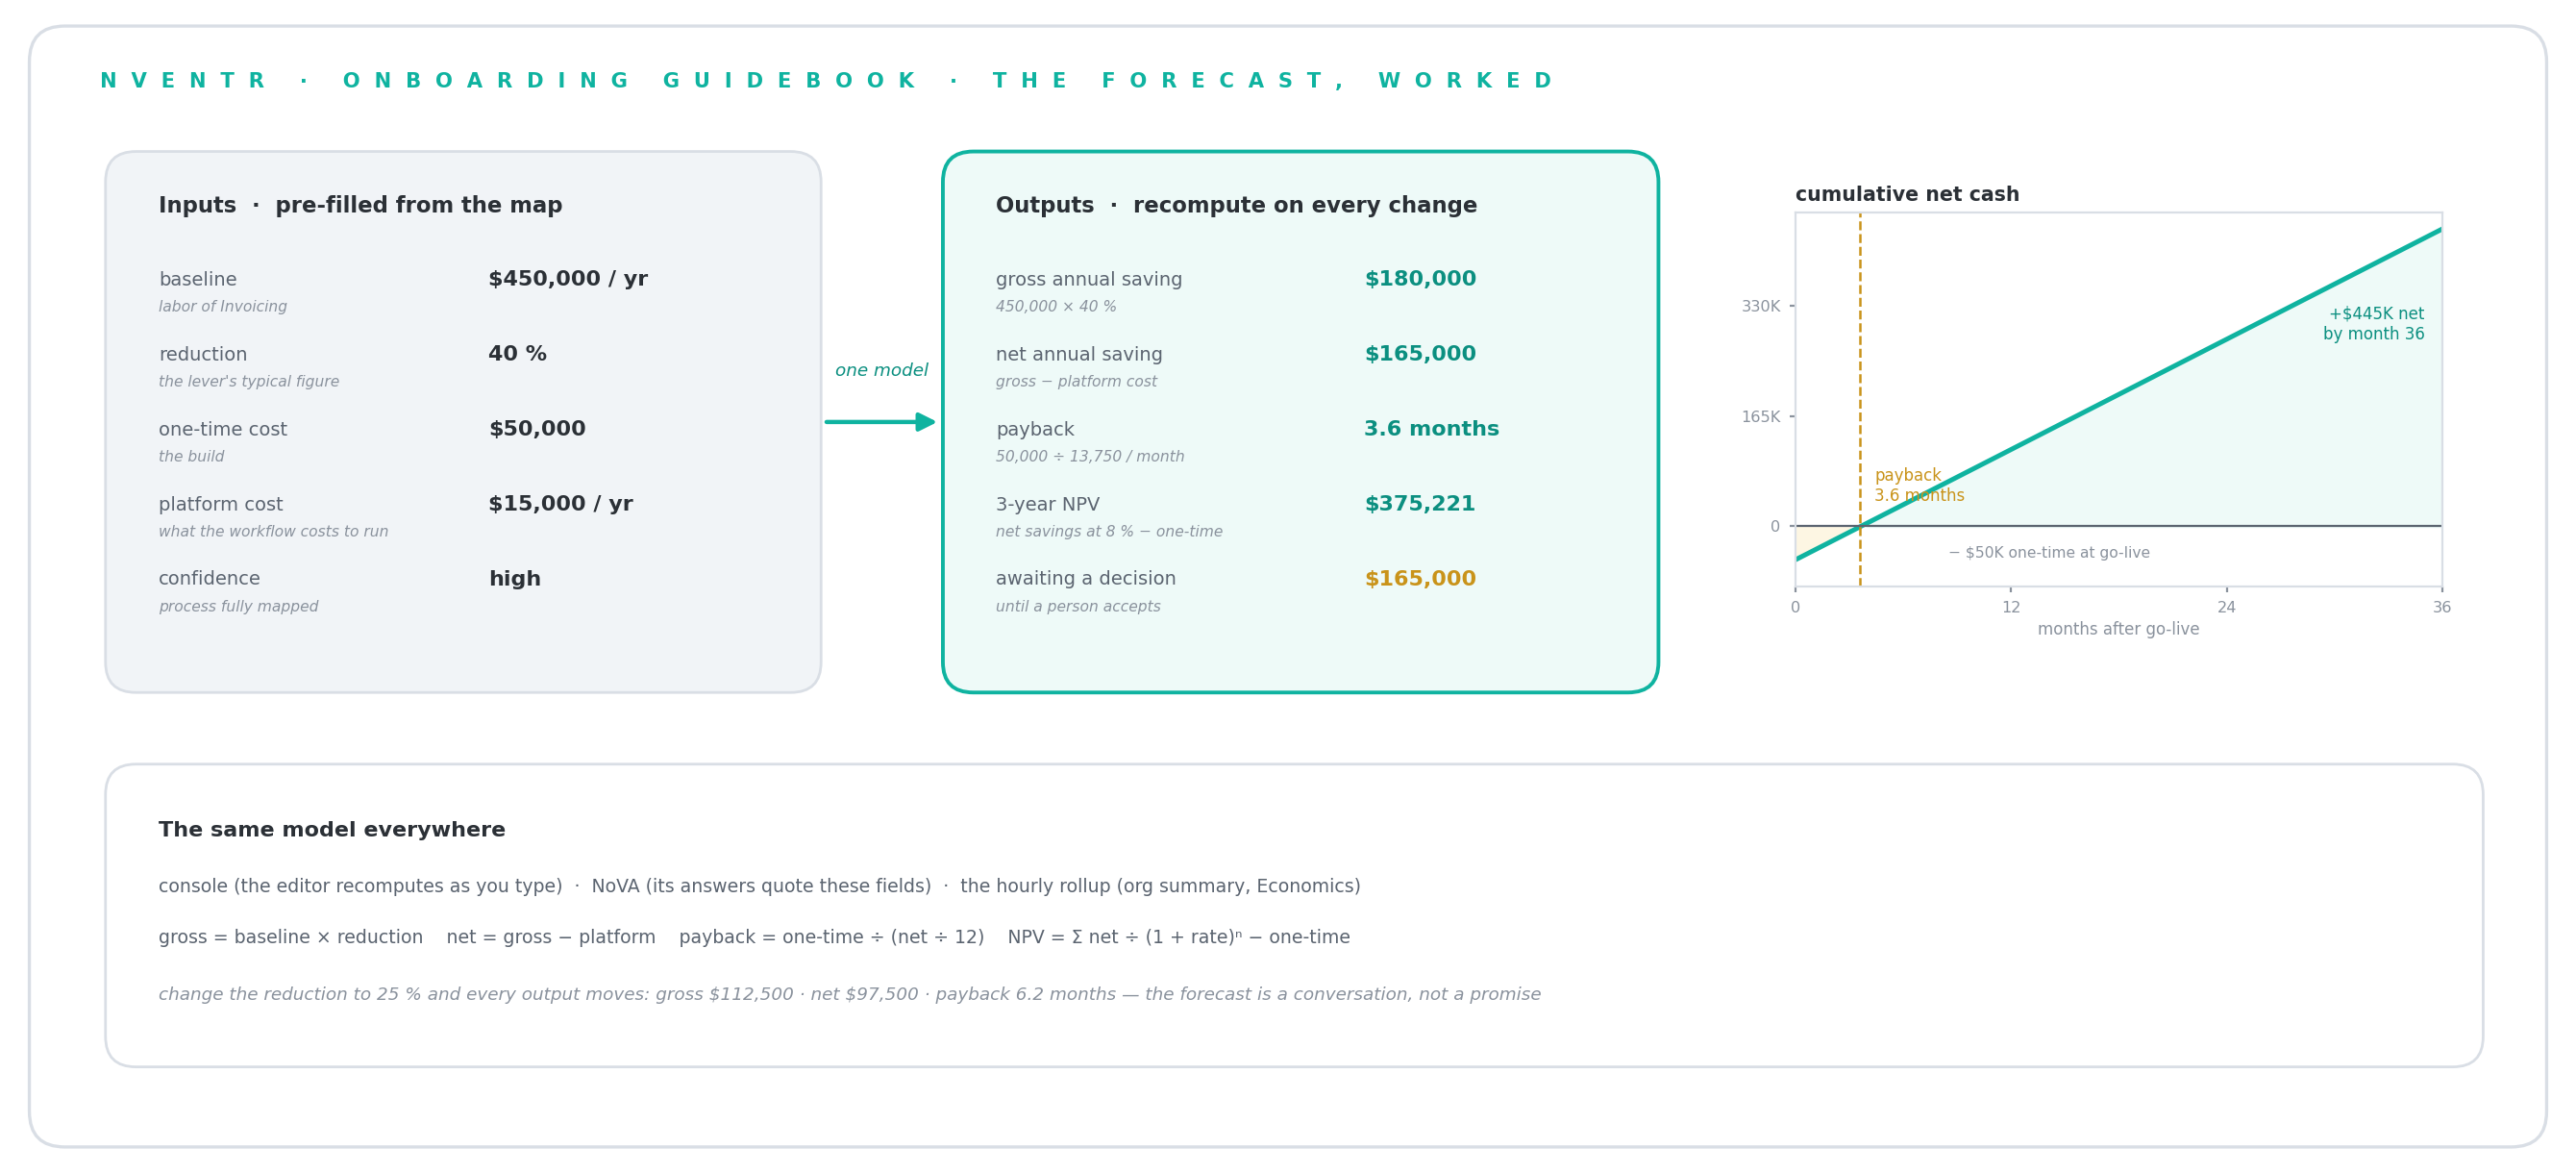
The forecast, worked — five inputs pre-filled from the map, six outputs from one model, and the cumulative cash curve crossing zero at payback
The forecast
Inputs, pre-filled from the map: baseline (labor, licenses, headcount, other), reduction, one-time cost, platform cost per year, confidence. Outputs: gross and net annual saving, payback in months, three-year NPV at your discount rate, and the rollups — total forecast savings, total investment, and the savings still awaiting a decision. Change any input and everything recomputes on the spot.
The realized column
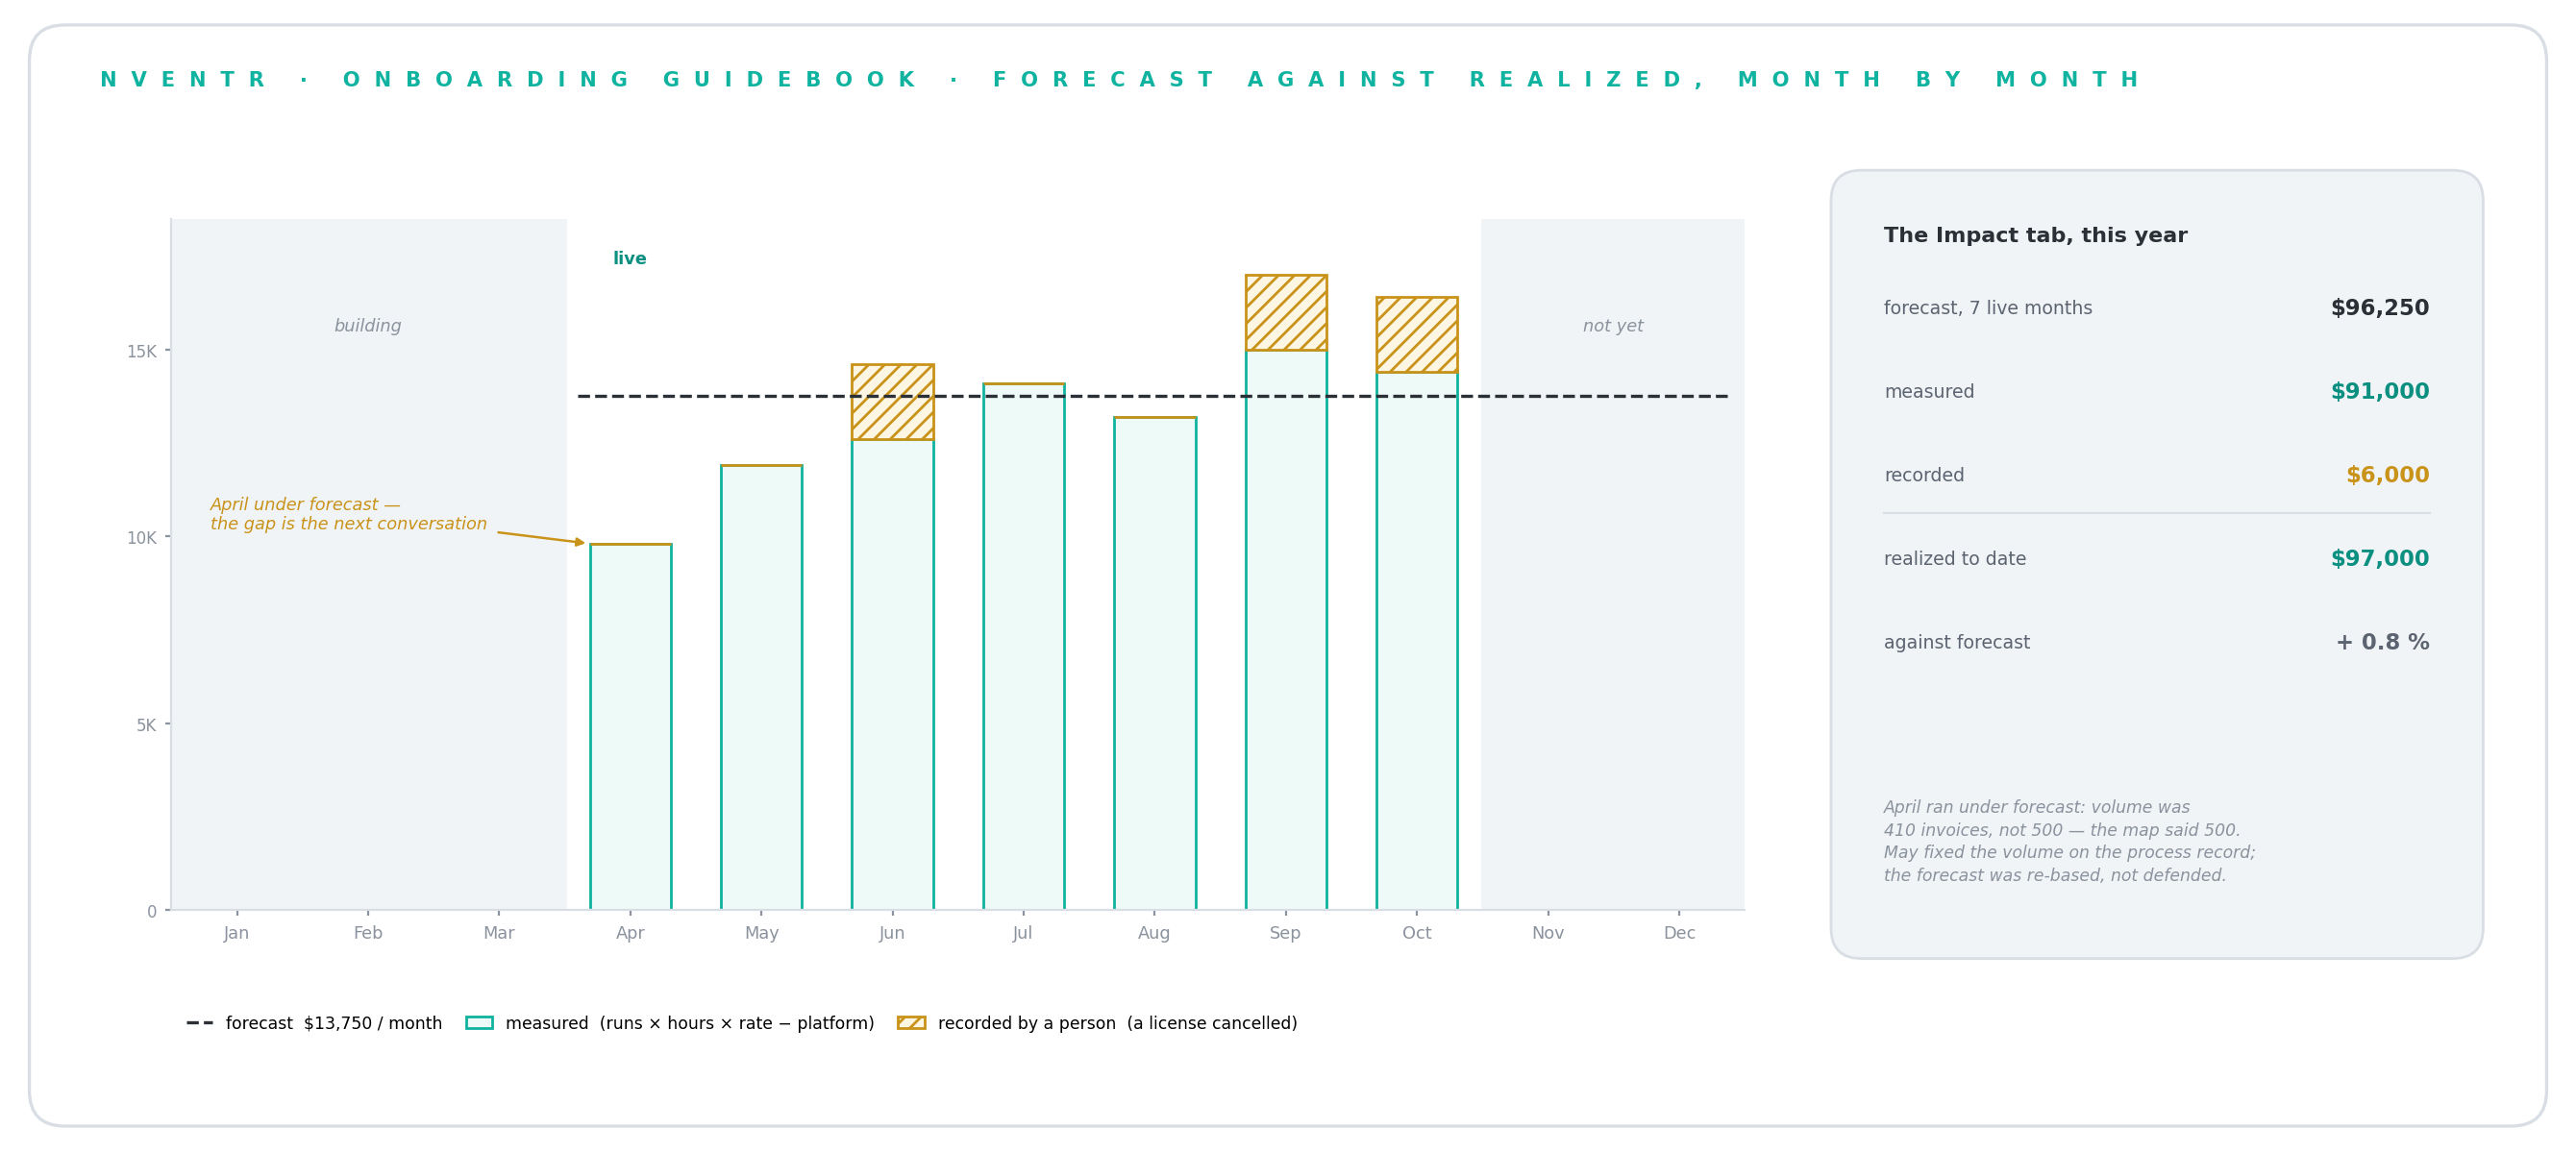
From the month an initiative goes live the platform measures it: workflow runs that month × the hours one run displaced × the loaded rate of the roles that used to do it, minus the platform cost of the deliverables. Anything the platform cannot see — a license cancelled, a hire deferred — a person records for the month with a note and their name. The gap between forecast and realized is not a failure; it is the next conversation.
Forecast against realized, month by month — measured savings from what ran, what a person recorded on top, and the ledger the Impact tab keeps
The initiative over time
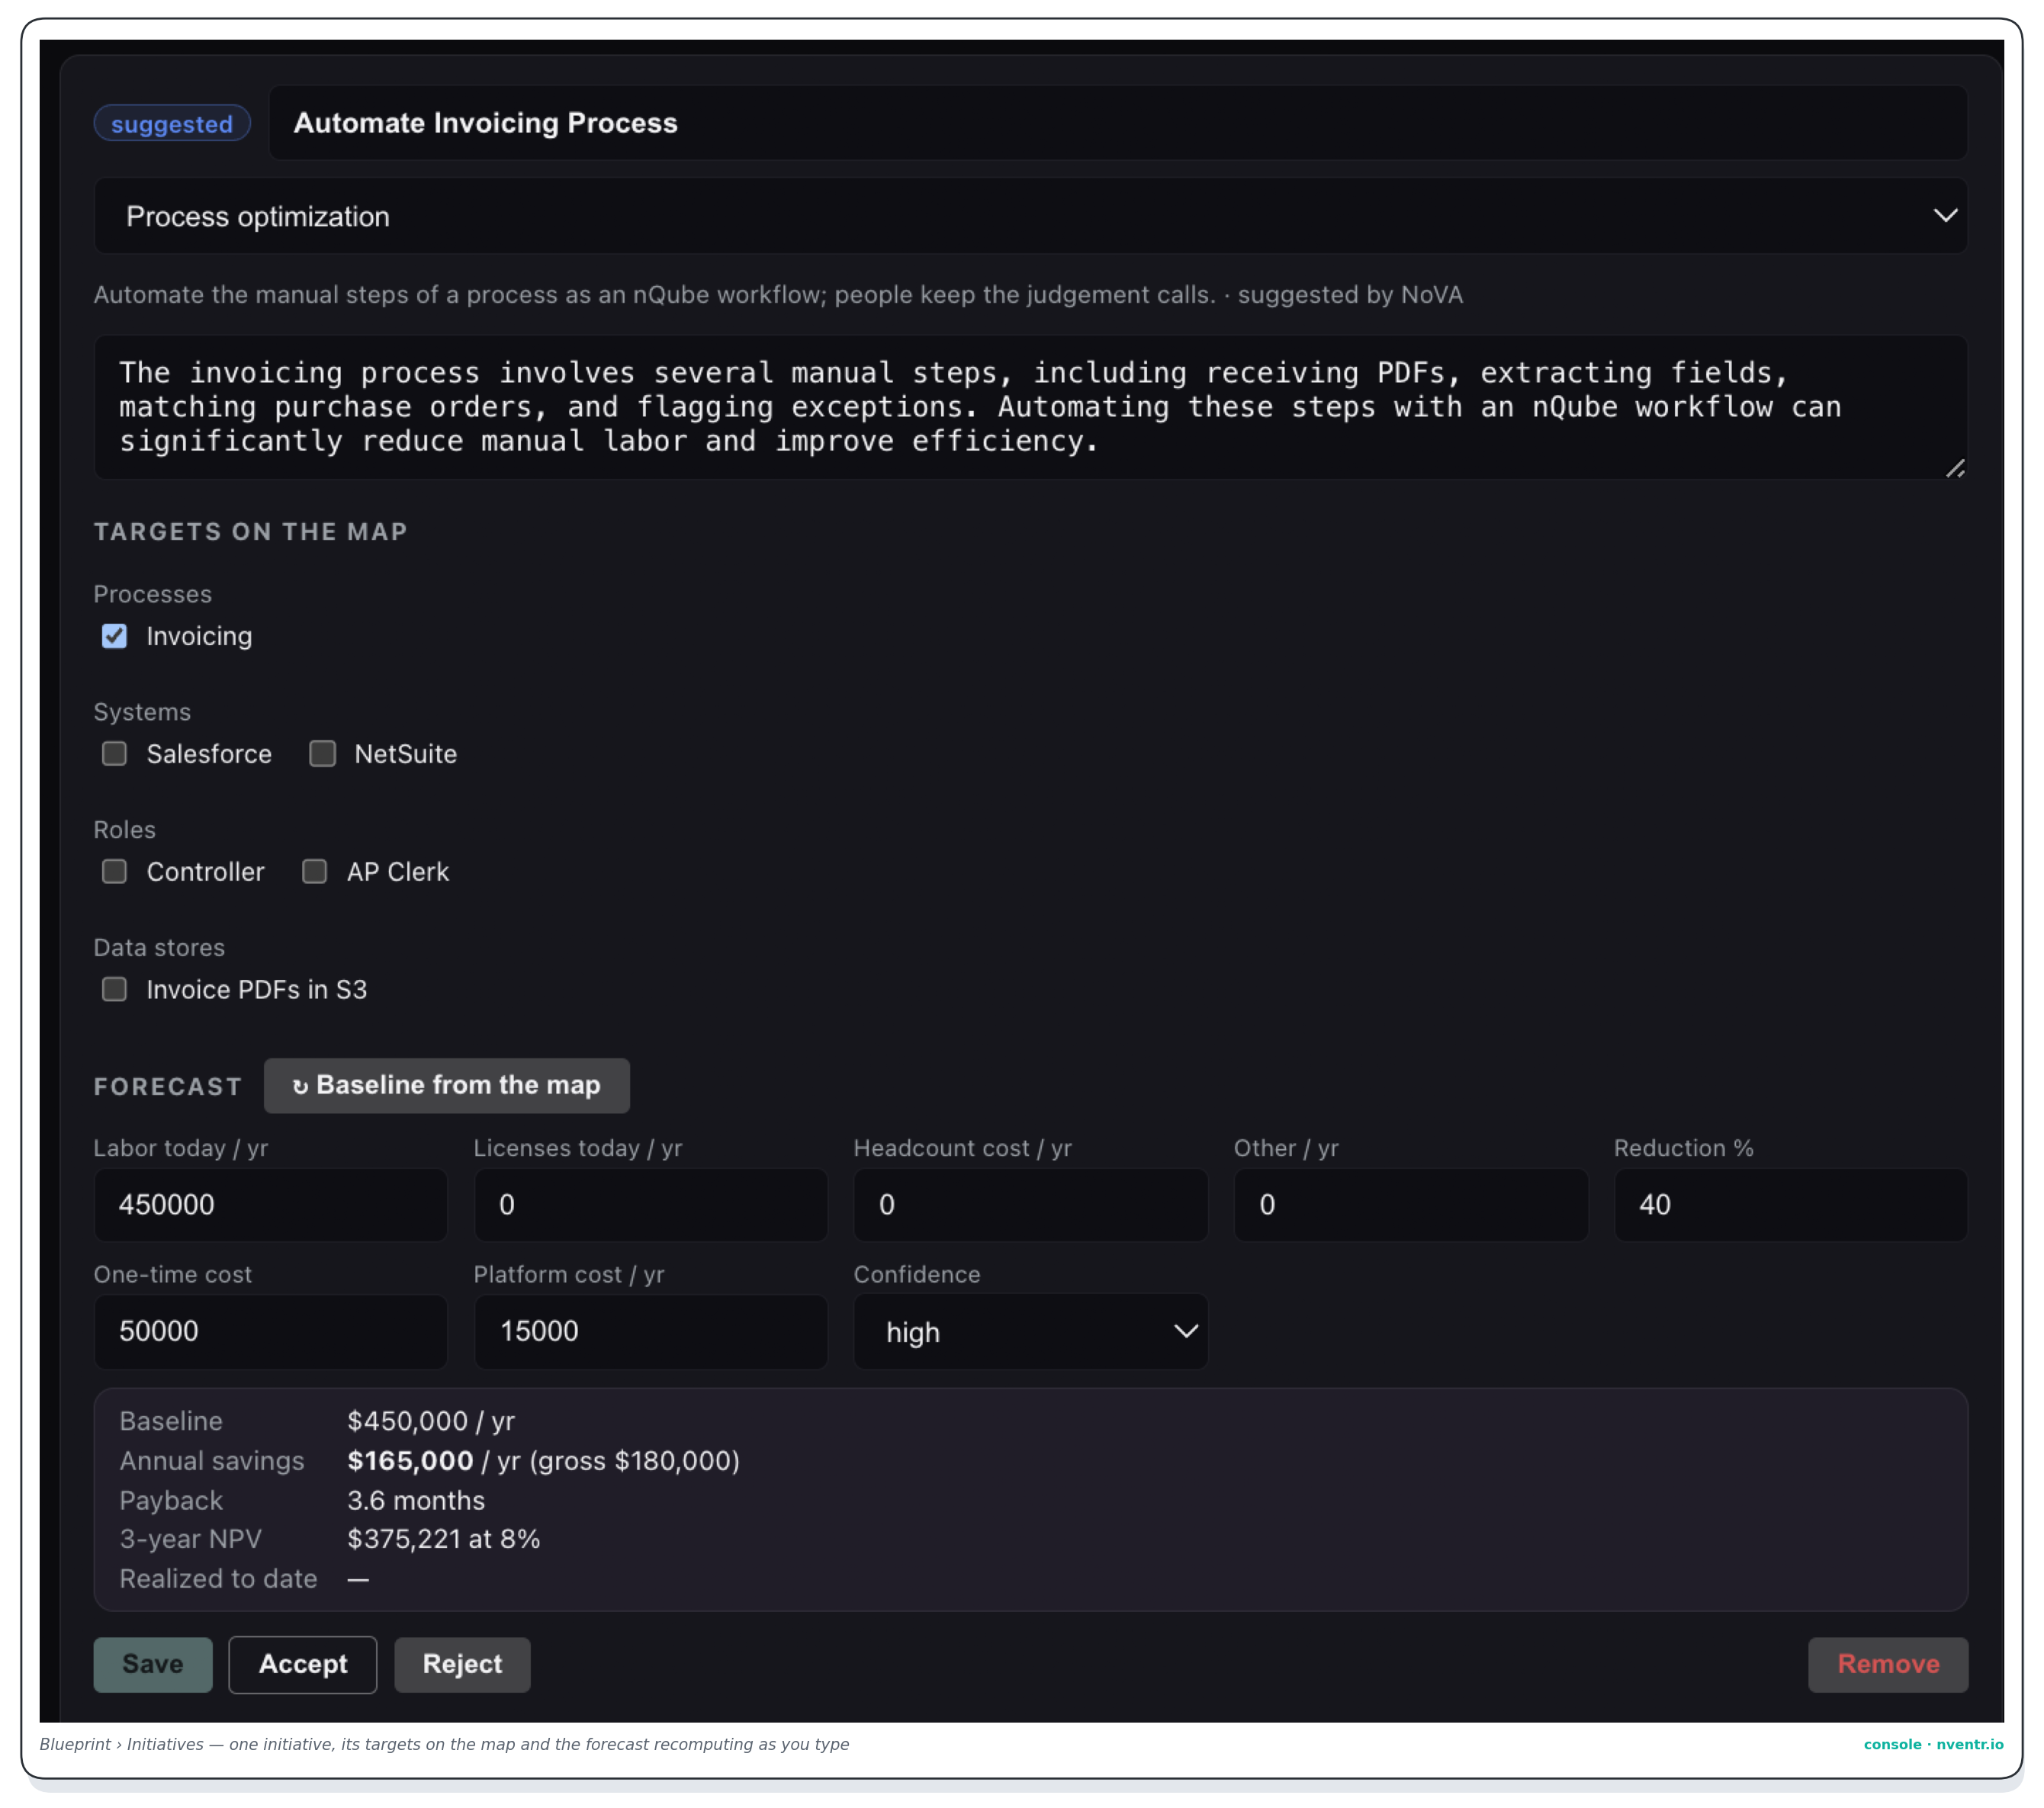
suggested → accepted → planned → building → live → measuring → done, or rejected with a reason at any point. Milestones carry due dates; deliverables carry links to what was built. The Impact tab shows forecast against realized by month, lever and initiative; the Economics module carries the plan's savings beside the month's margin.
One initiative in the console — its lever and rationale, its targets on the map, the forecast recomputing as you type, and the decision buttons only a person may pressPart VI
The 30 / 60 / 90 plan
A quarter from an empty map to two initiatives live, a bigger one planned, and a rhythm the organization runs itself.
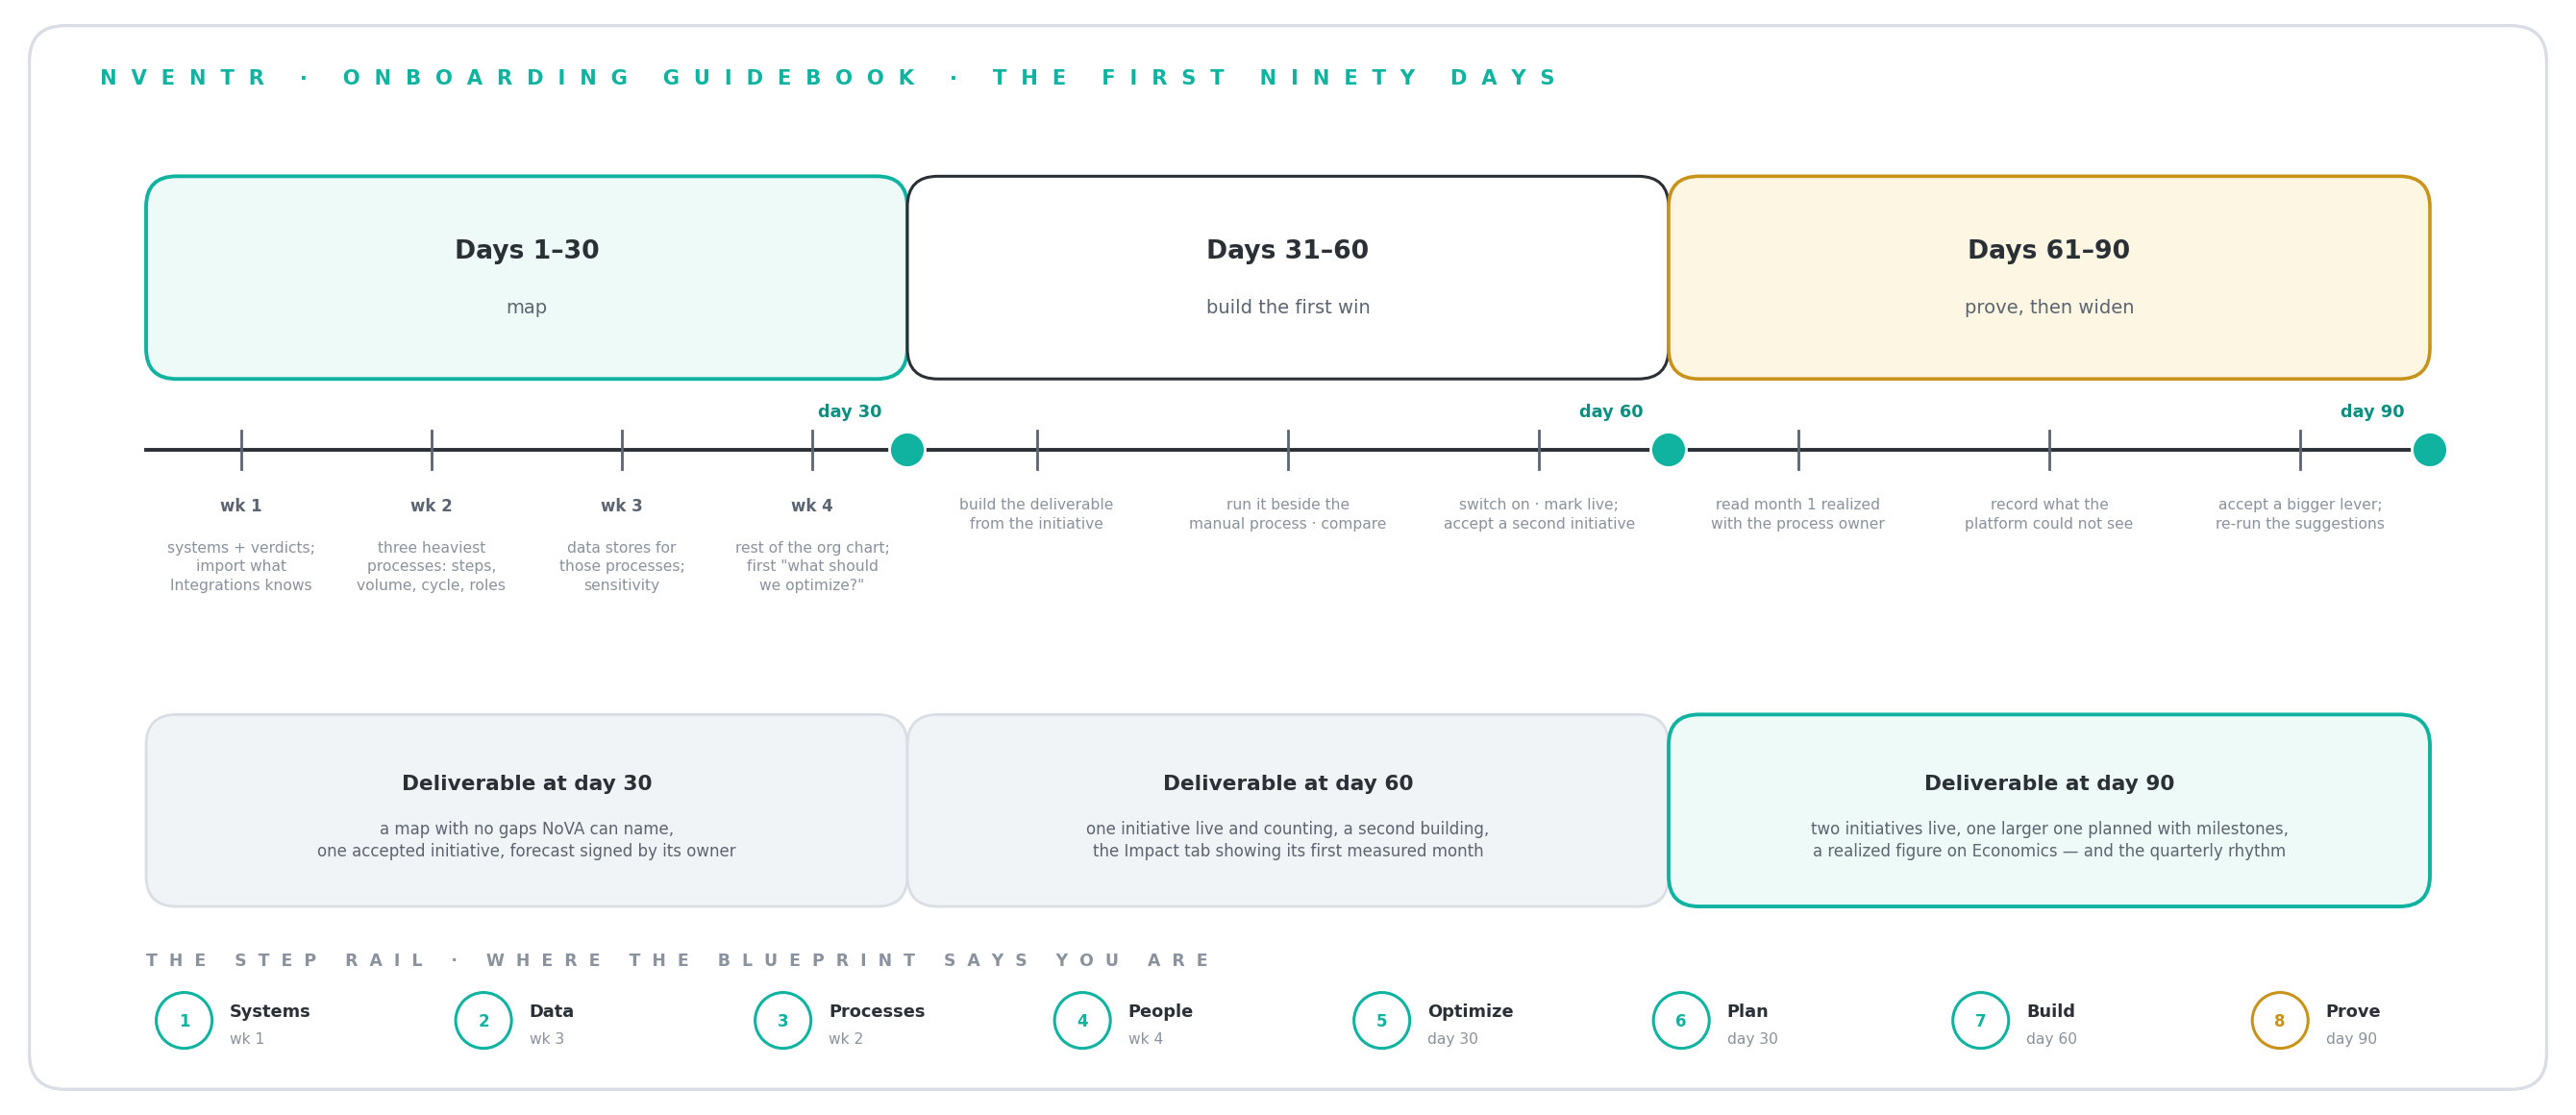
The first ninety days — three bands, what happens each week, the deliverable at each milestone, and where the step rail says you are
Days 1–30 — map
Systems with verdicts; the three heaviest processes fully; the roles that run them with loaded cost; data stores for those processes; the rest of the org chart; the first "what should we optimize first". Accept one process- or augment-lever initiative with payback under six months.
Days 31–60 — build the first win
Build the first deliverable with NoVA from the initiative itself. Run it beside the manual process for a week; compare; switch it on; mark it live. Accept a second initiative that reuses the first one's integration or dataset.
Days 61–90 — prove, then widen
Read the first realized month against the forecast with the process owner; adjust. Record what the platform could not see. Use that number to accept the first bigger lever. Re-run the suggestions — the map has changed. By day 90: two initiatives live, one larger planned, a realized figure on Economics, and a quarterly rhythm — map, suggest, accept, build, measure.
Where to click
Everything in this guide is one place in the console: Blueprint, in the Build section of your organization. Its tabs are the chapters — Map, Systems, Data, Processes, People, Initiatives, Impact — and the first time you open it NoVA offers to interview you. Say yes.